Daily Options Analytics give you X-ray vision into the options market. While options flow shows you what traded, daily analytics show you where all the money is positioned right now—and what that means for price action. This guide will teach you how to use all 7 analytics charts to find high-probability trades and avoid dangerous setups.
What Are Daily Options Analytics?
Daily Analytics are snapshots of the entire options chain for a stock on a specific trading day. They answer critical questions:
- Where are the support and resistance levels from options?
- Will the stock be volatile or range-bound today?
- What’s the institutional positioning bias?
- Where is the capital concentrated?
- What does the market expect to happen?
Unlike options flow (which shows trades), daily analytics show positions. It’s the difference between watching people buy groceries vs. seeing what’s in everyone’s pantry.
The 7 Daily Analytics Charts
1. Option Walls
Option walls are strikes with massive open interest that create “magnetic” price levels due to market maker hedging activity. Call walls (highest call OI above current price) act as resistance, while put walls (highest put OI below price) act as support. These levels often constrain price movement as market makers hedge their positions by buying or selling the underlying stock. Use option walls to identify key price levels for entries/exits, set profit targets at the walls, or trade breakouts when price moves through major walls with strong volume.
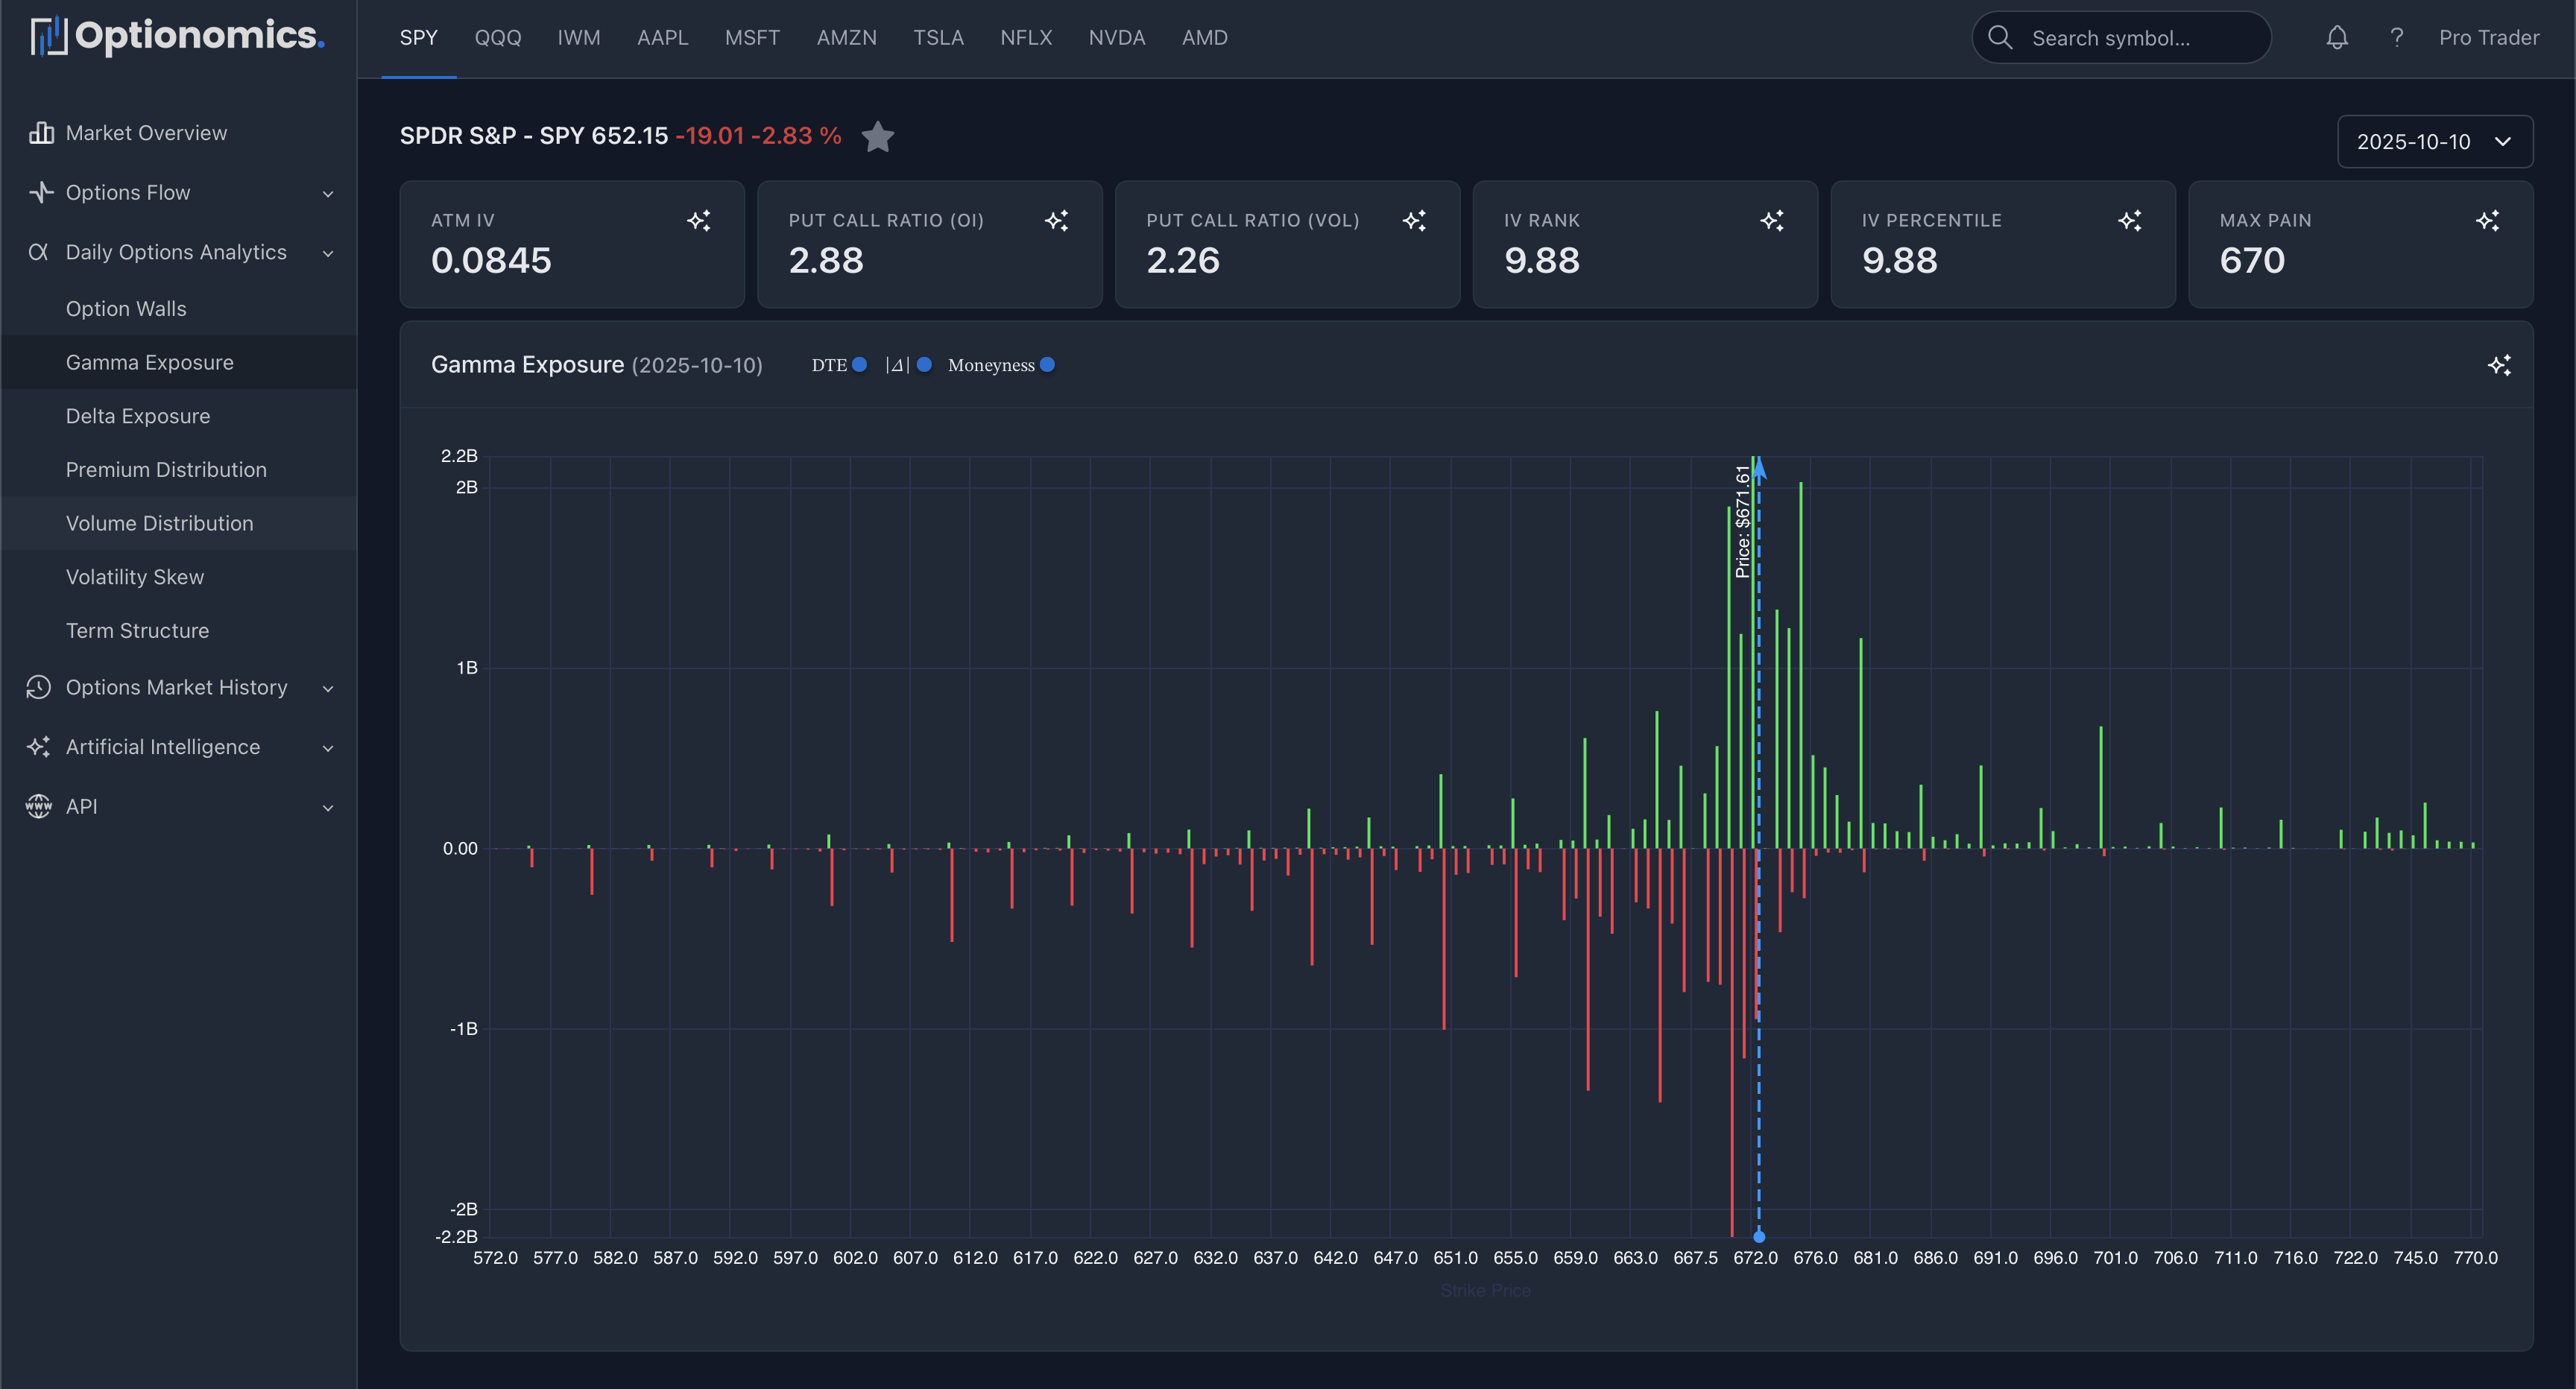
2. Gamma Exposure (GEX)
Gamma Exposure (GEX) measures how much stock market makers must buy or sell to stay hedged when the stock moves 1%, making it the single best predictor of whether the stock will be volatile or stable. Positive GEX means market makers dampen volatility by selling rallies and buying dips, creating range-bound conditions, while negative GEX means they amplify volatility by buying rallies and selling dips, fueling trending moves. Use GEX to set trading strategy—trade ranges and sell options in positive GEX environments, or trade breakouts and buy options in negative GEX conditions, especially when GEX flips from positive to negative or vice versa.
3. Delta Exposure
Delta Exposure shows the net directional exposure from all options positions—calls have positive delta (gain when stock rises) and puts have negative delta (gain when stock falls), aggregated across the entire chain. Positive net delta indicates bullish institutional positioning, while negative net delta suggests bearish hedging or positioning. Use extreme delta readings (>80th percentile) to identify potential trend exhaustion points or continuation signals, and watch for delta shifts that often precede directional moves.
4. Premium Distribution
Premium Distribution shows the notional value (dollar amount) of open interest by strike, answering “Where is the money?” Large premium concentrations indicate where institutional capital is positioned, often creating support/resistance or attracting price. Use this to identify which strikes have the most capital at risk, set profit targets at premium concentration levels, or fade moves away from major premium clusters as they often act as magnets on expiration.
5. Volume Distribution
Volume Distribution shows where trading activity (volume) is concentrated across strike prices, revealing which options traders are actively buying and selling today. High volume at specific strikes indicates current market interest, potential support/resistance levels, or where large positions are being established. Use this to identify “hot” strikes where action is happening, compare volume to open interest to spot new positioning (high volume vs low OI), or trade toward high-volume strikes as they often act as short-term magnets.
6. Volatility Skew
Volatility Skew shows how implied volatility (IV) differs across strike prices—not all options are priced equally, as the market prices different strikes with different IV based on supply/demand and perceived risk. Steep put skew (higher IV on downside puts) indicates fear and expensive downside protection, while steep call skew suggests speculation or supply constraints. Use skew to find relative value—buy options where IV is cheap (flat areas) and sell where it’s expensive (steep areas), or use skew shape to gauge market sentiment and position accordingly.
7. Term Structure
Term Structure shows implied volatility plotted by expiration date, revealing how volatility expectations evolve over time, event risk (earnings, FDA, etc.), and calendar spread opportunities. Contango (upward sloping curve) indicates normal conditions where long-term IV is higher than short-term, while backwardation (inverted curve) signals near-term event risk or crisis. Use term structure to identify calendar spread opportunities in contango environments, spot upcoming events (spikes in specific expirations), or fade extreme term structure inversions as they often normalize after the event passes.
Remember: Analytics show probabilities and positioning, not certainties. Always use proper risk management, set stops, and size positions appropriately. Markets can override options analytics with unexpected news or flow.
Last updated: October 2025