Market Overview
The whole options market on one page
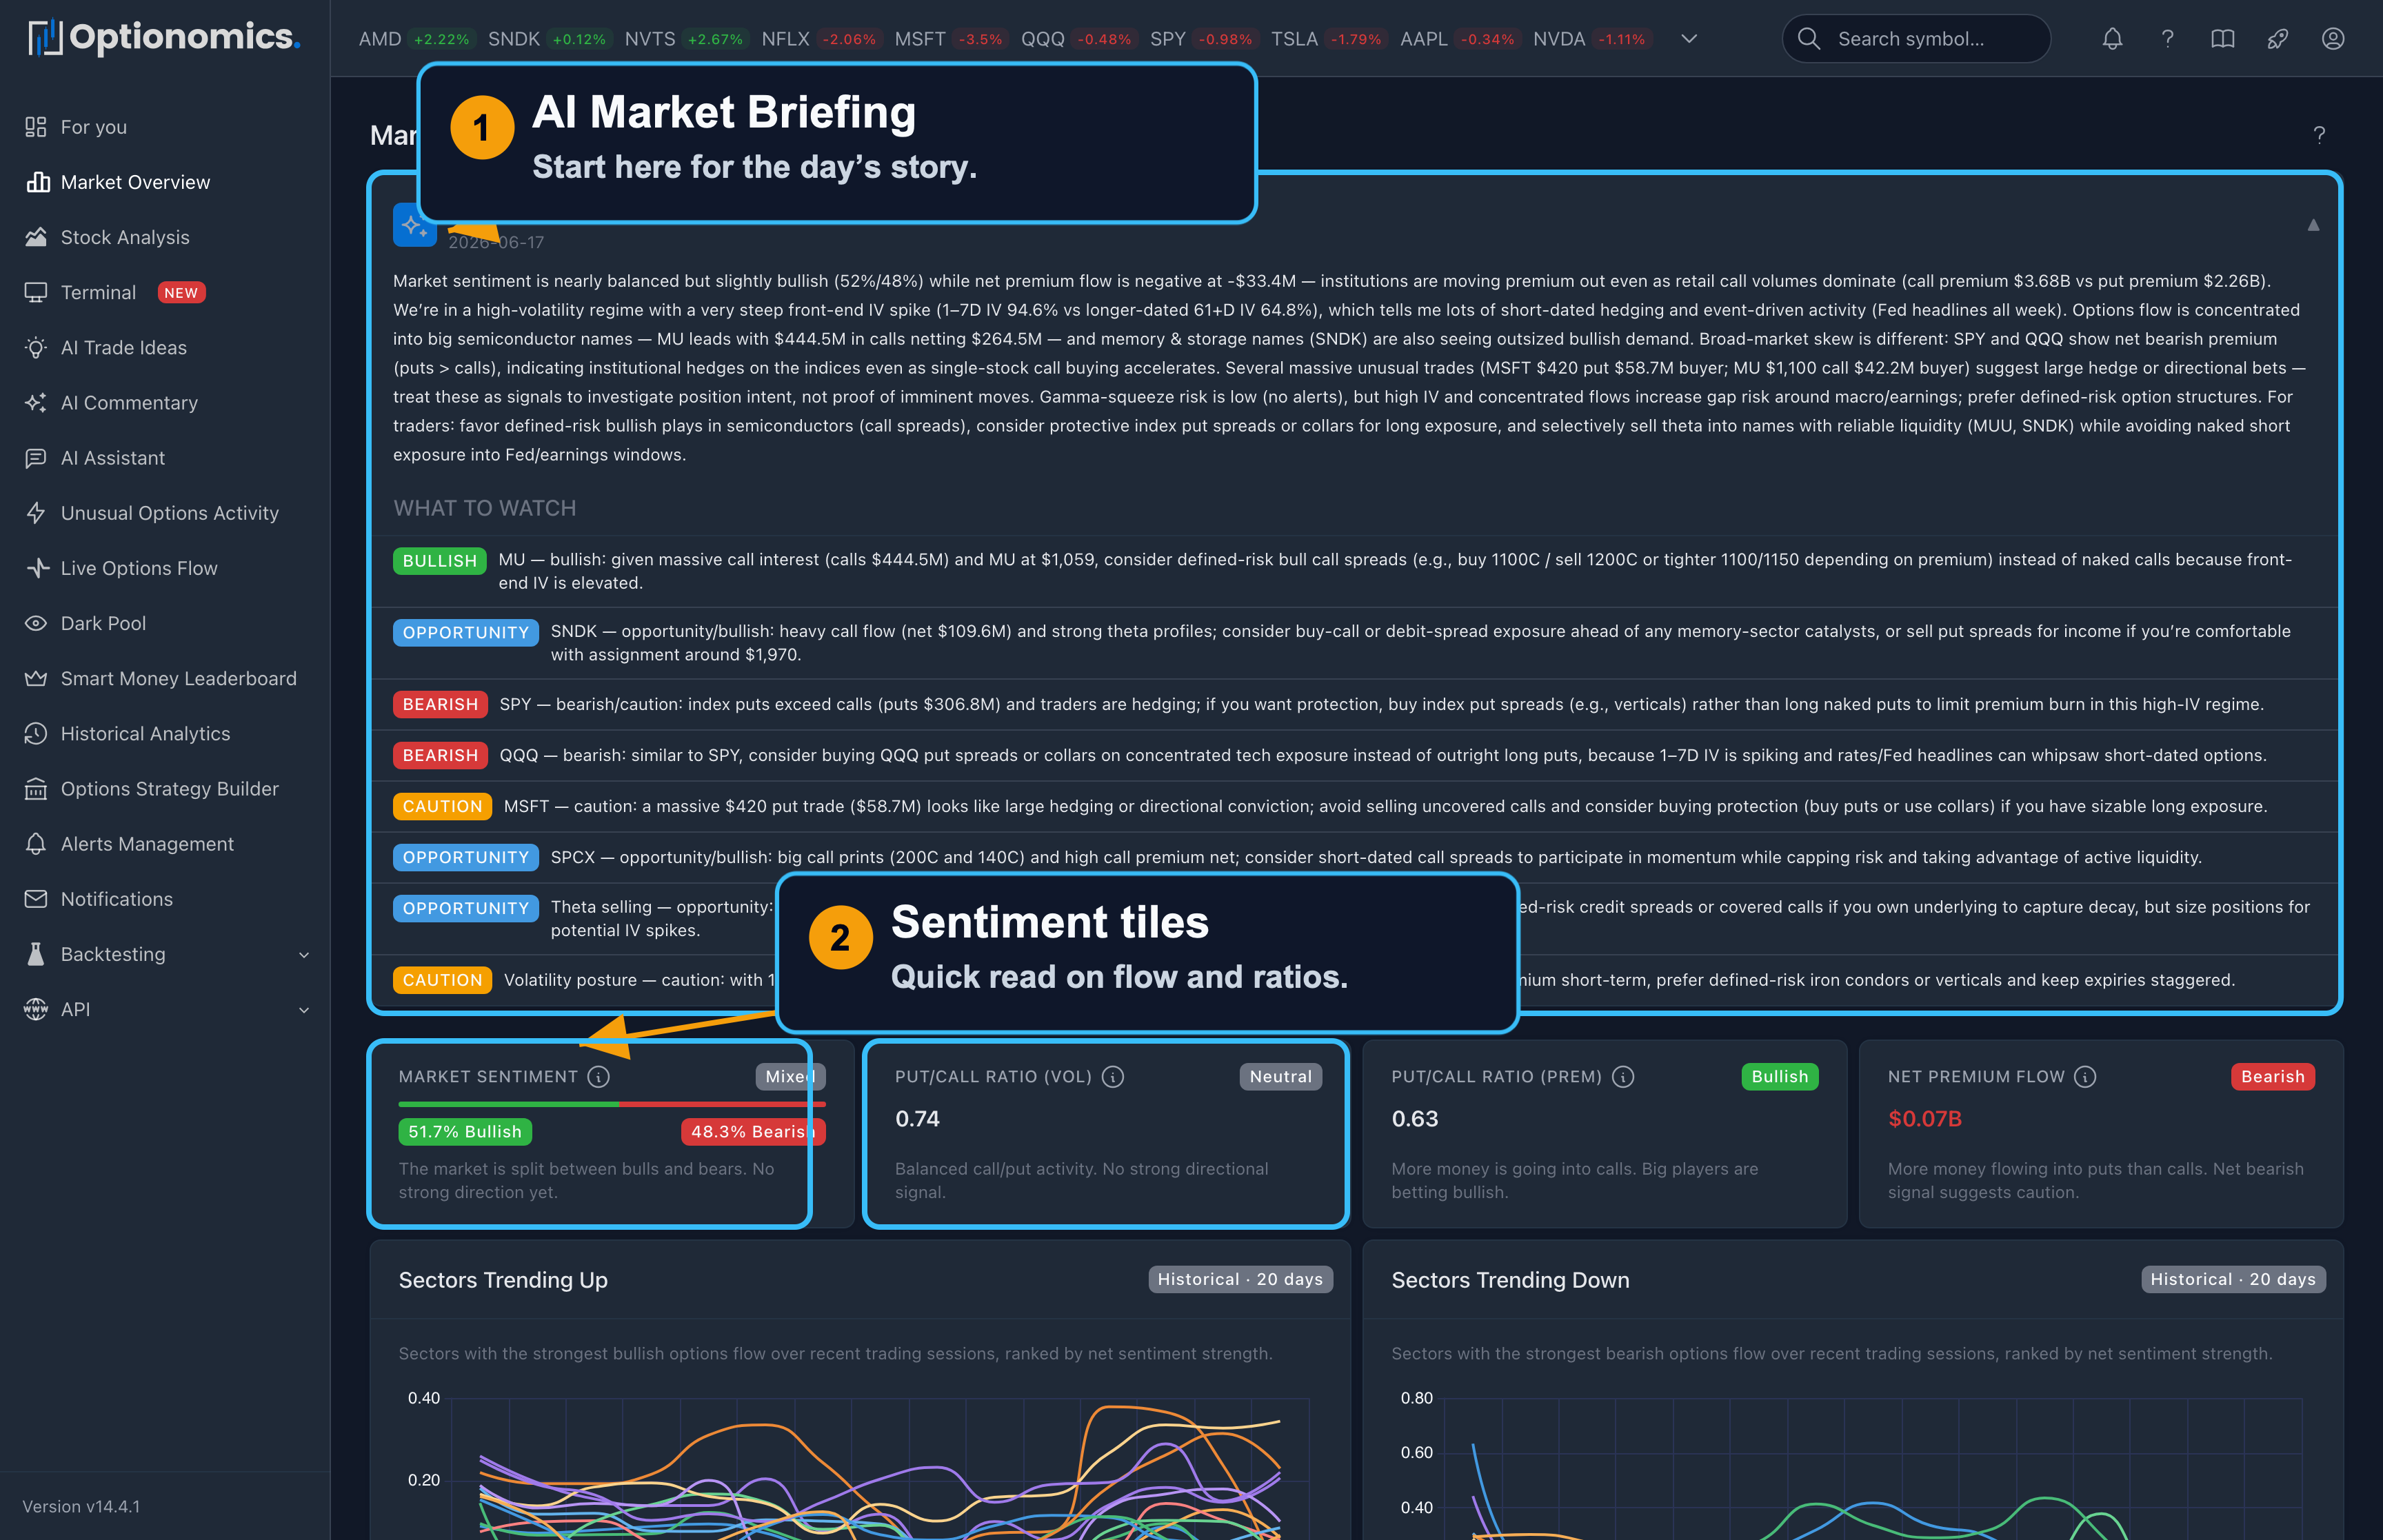
The Market Overview is designed as a first stop before you drill into single names. Instead of loading ten tickers to ask “is risk-on or risk-off showing up in options?”, you get a single canvas: broad sentiment, flow-weighted hints, unusual prints surfaced at the market level, and lists that highlight where activity clusters. From here you typically jump to options flow, a Stock Workspace, or daily analytics once you know which stories matter today.
Availability: All plans (Delta and higher)
Open it: Choose Markets from the sidebar, or open /overview. The header shows the session date and last-update time, with a live badge during today’s session and a manual refresh.
AI Market Briefing
The page opens with an AI Market Briefing: a short narrative of what the tape is doing today—sentiment, where premium is concentrating, what stands out—plus a What to Watch list of suggested follow-ups tagged bullish, bearish, or opportunity. Treat it as orientation, not a recommendation; every claim can be cross-checked in the sections below it. Several sections further down also carry a one-line AI insight strip commenting on that panel’s data.
Key Indicators
Four tiles summarize how the aggregate options complex is behaving, each with a plain-English explainer:
| Indicator | What It Shows | Interpretation |
|---|---|---|
| Market Sentiment | Bullish vs bearish % of classified flow | The balance of the day’s tape |
| Put/Call Ratio (Vol) | Put/call by contracts | >1.0 = more puts traded (defensive) |
| Put/Call Ratio (Prem) | Put/call by dollars, with a net-premium sparkline | >1.0 = more $ in puts (defensive) |
| Net Premium Flow | Net $ into calls vs puts | Positive = net bullish flow |
Sectors and today’s catalysts
- Sectors Trending Up / Trending Down — which sectors gained or lost flow over the last ~20 trading days.
- Hot & Cold Sectors — intraday sector activity, so you can see today’s rotation as it happens.
- Today’s Catalysts — the session’s earnings and macro prints condensed from the Market Calendar, grouped by bell: before the open, during the session, and after the close.
Volatility and flow panels
Working down the page:
- IV Term Structure — how implied volatility is priced across expirations at the market level.
- Options Flow by Stock — a spatial summary of many symbols at once, colored by net call vs put tone, so you spot pockets of bullish or bearish premium without opening each chain. Green means call-side dominance; red means put-side.
- Most Bullish / Most Bearish Stocks — names with strong one-sided classified premium.
- Volume Leaders — symbols with the heaviest displayed options volume.
- Big Money Trades — the day’s outsized prints, with stock, direction, strike, size, and execution side, linking into Unusual Options Activity.
- High IV Stocks and IV Trends — where implied volatility is elevated, and how it has trended.
- Theta Decay — income-oriented context for premium sellers—where time decay is rich today.
- Volatility Skew — skew-based callouts labeled Looks Cheap, Looks Expensive, or Fair Value, with a link into the per-symbol skew chart.
- Optionomics Market Pulse — a breadth-and-volume-pressure read across liquid US stocks: the intraday bias, next-session context, and the reasons behind the call, with a confidence level.
- Volume Spikes — contracts running far above their normal volume over the last 30 days, split calls versus puts.
Clicking a symbol in these charts opens its tape on Options Flow.
How to Use Market Overview
Typical workflow
- Read the briefing and glance at sentiment, put/call ratios, and net flow.
- Check Today’s Catalysts so scheduled events don’t surprise you.
- Scan the sector tiles and Big Money Trades for catalyst or positioning stories.
- Pick a small set of symbols from the movers and leaders, then open each in flow or analytics for the actual trade structure.
Related Features:
- Unusual Activity — detailed unusual trade analysis
- Options Flow — the live trade stream
- Market Calendar — the full earnings and macro timeline
- Daily Analytics — deep dive into positioning
Remember: Market Overview summarizes market data. Classifications and AI summaries can be incomplete or wrong, and no panel is a trading instruction. Verify important observations in the underlying tools.
