Unusual Options Activity
The curated, scored view of the options tape
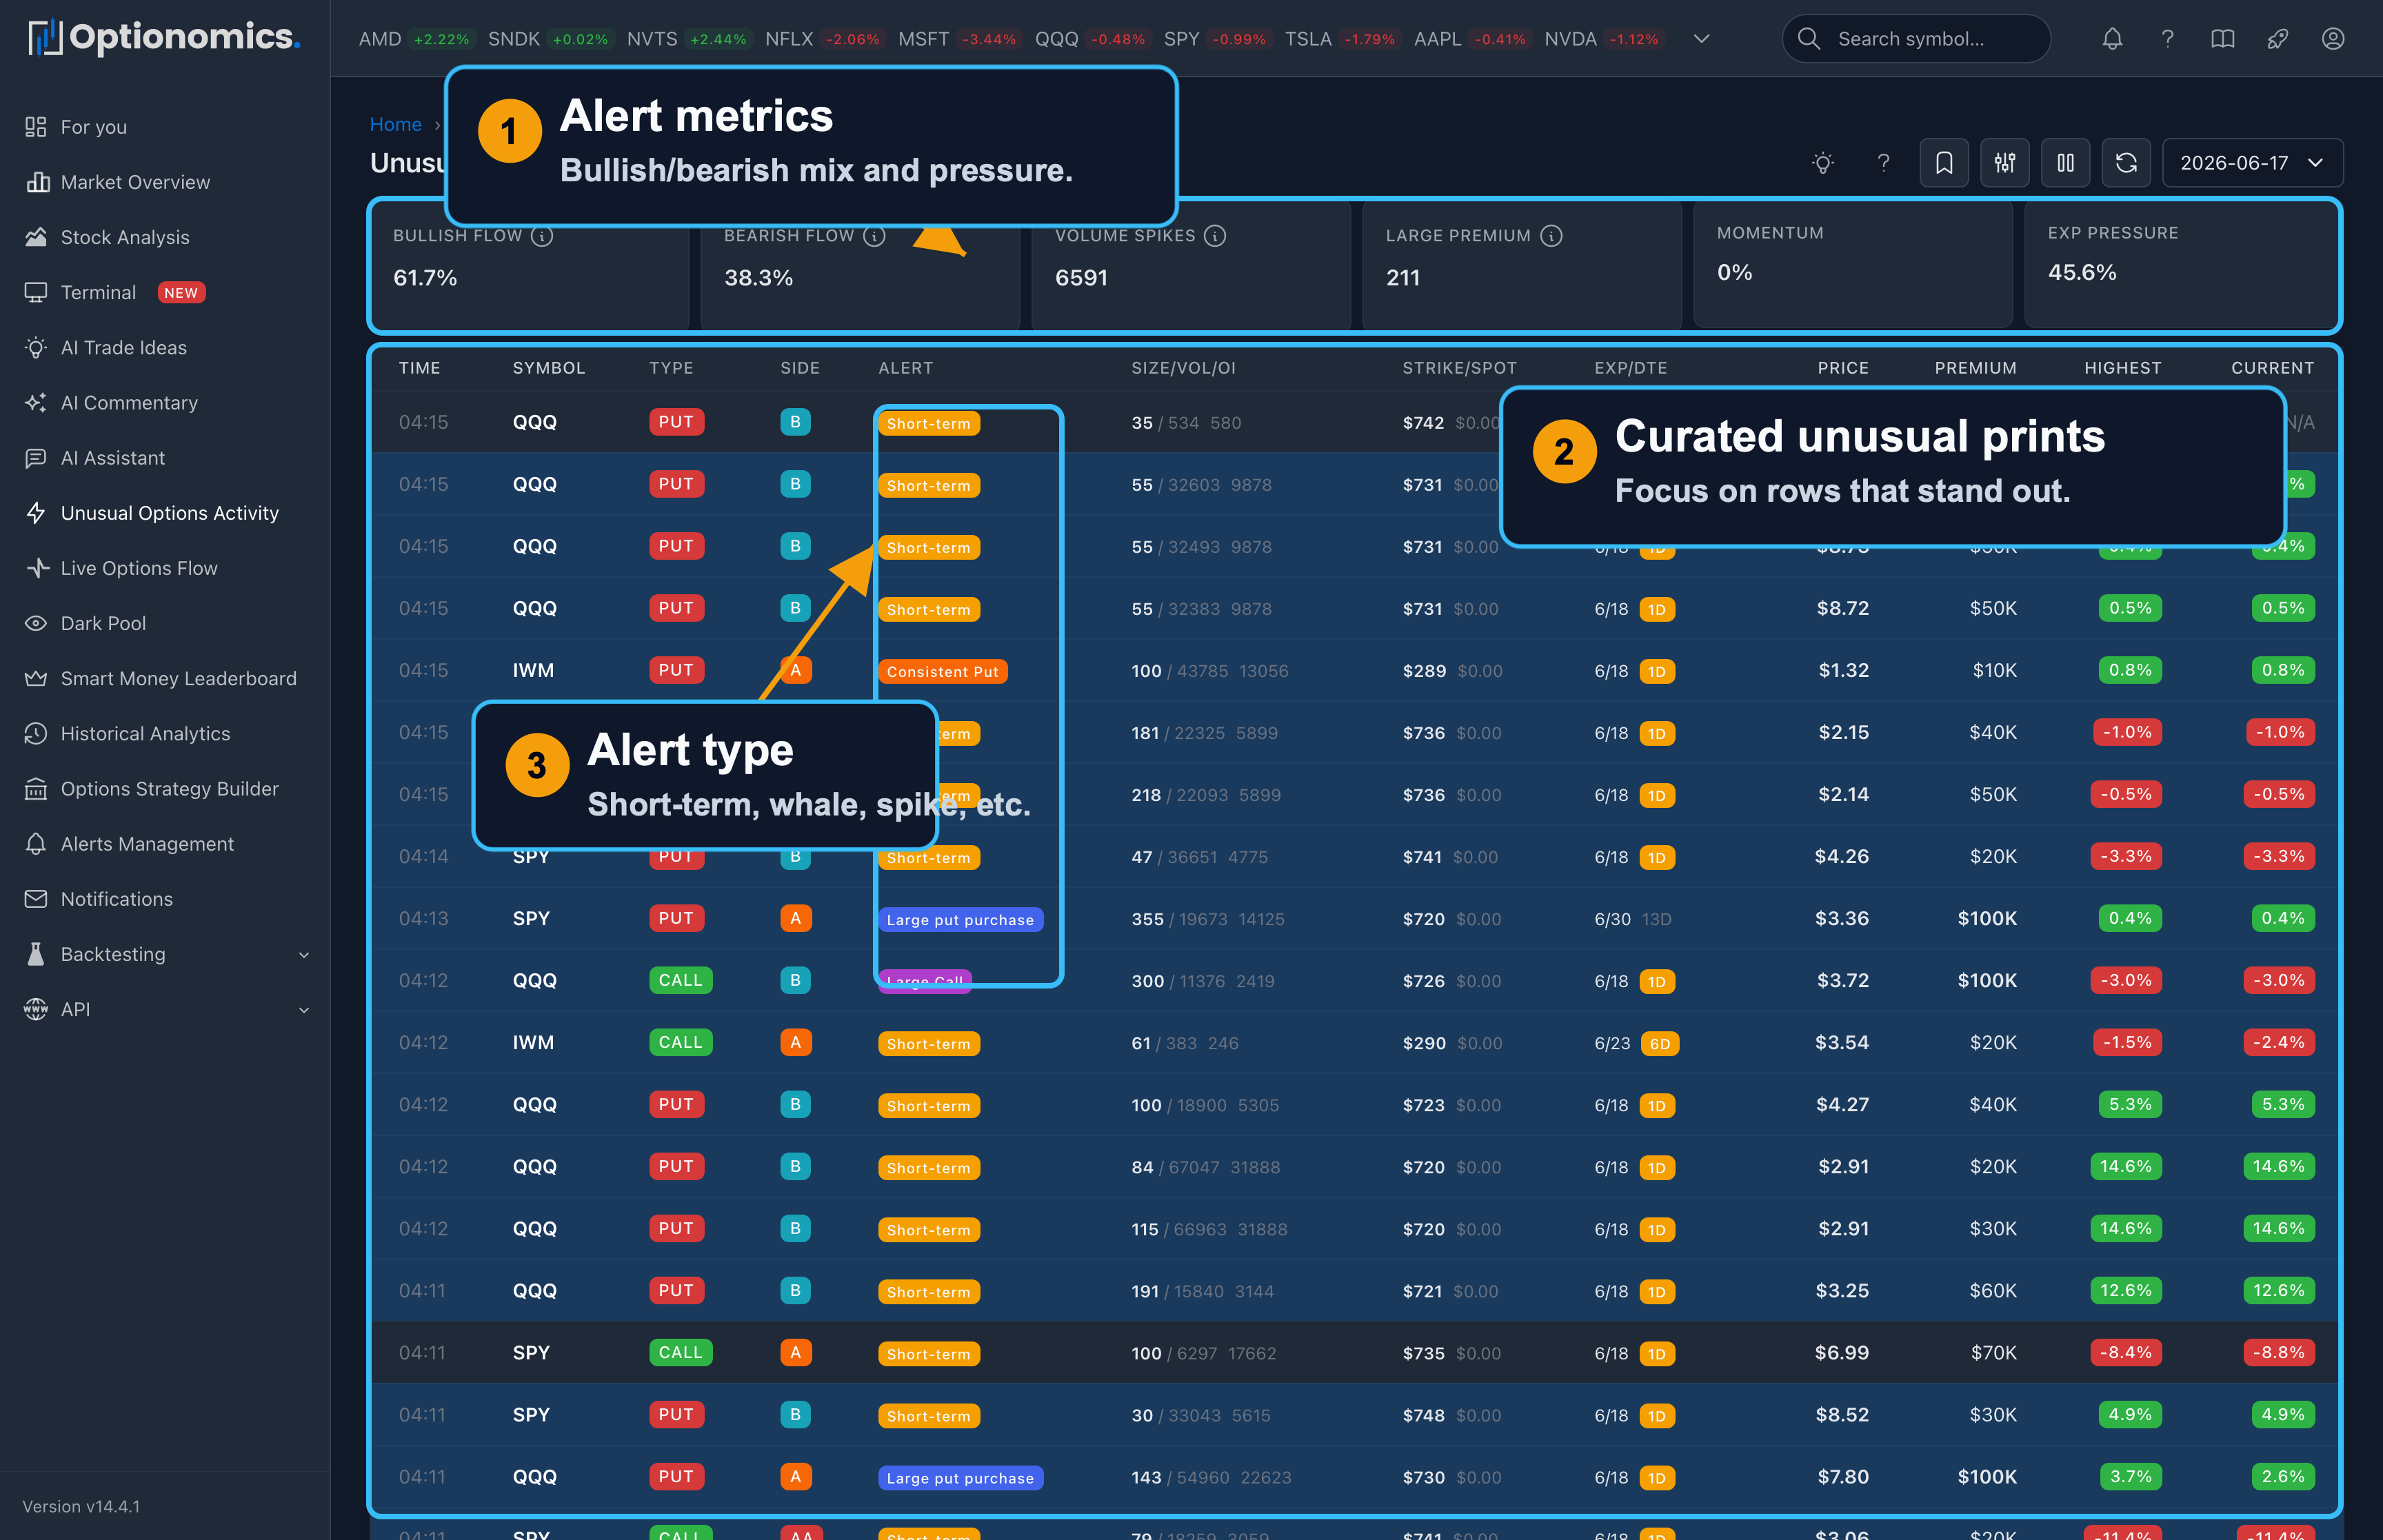
What Unusual Options Activity is for
The Live Options Flow page is the full tape: every print you are allowed to see, as fast as it arrives. Unusual Options Activity is the curated view: trades and patterns that score high against historical and cross-sectional norms, so you spend less time scrolling and more time on prints that often (not always) matter for positioning, events, or follow-up research.
Think of it as a priority queue for follow-up research. Each alert carries a user-facing classification and an unusual score you can filter on, and the page tracks how the underlying moved after each alert so you can see which callouts aged well.
Availability: Included with plans that carry live options flow—Gamma and higher.
Open it: Sidebar → Unusual Activity (also at /uoa). The tape switcher in the header moves between Flow, UOA, and Dark pool.
How this page fits with the rest of the product
| You want to… | Start here |
|---|---|
| See every trade and build your own mental filter | Live Options Flow |
| Focus on scored unusual prints and alert taxonomies | This page (Unusual Options Activity) |
| Get notified when criteria match | Alerts Management |
| See flow on the chart | Terminal |
Suggested workflow: Use Unusual Activity to shortlist names, then open each symbol’s daily or historical analytics, news, and the full chain so you understand structure (single leg vs spread, hedge vs speculation) before you act.
The summary rule
| Tile | What it shows |
|---|---|
| Alerts | How many alerts the session produced in scope |
| Premium | Total premium behind them |
| Bullish / Bearish | The direction split of the alerts |
| Pace | The current slice versus the session average |
| Avg score | Average unusual score |
| Volume spikes | Alerts where volume ran a multiple of its average |
| Large premium | Count above the large-premium threshold—clickable |
| Near expiry | The share expiring within 7 days—clickable |
A session ribbon under the tiles draws bullish premium above the line and bearish below, slice by slice; drag it to narrow the page to a time window, exactly as on the Flow page.
The table: two grains
- Alerts — one row per alert: Time, Symbol, Type, Side, Alert (the pattern badge), Size/Vol/OI, Strike/Spot, Exp/DTE, Price, Premium, Highest and Current.
- Spot is the underlying’s latest price this session.
- Highest and Current are post-alert underlying returns—the best favorable move since the alert, and where it stands now. They are context, not your P&L.
- Symbols — one row per ticker: alert count, premium, and a bullish/bearish lean bar. Use it to see which names the detectors keep flagging.
Hover an alert row for a contract chart popover, and click a row for the same context menu as Flow—focus the symbol or contract, add to a watchlist, Set Alert, open the Flow Snapshot detail card (which includes the raw unusual score), or open the contract history.
Activity classifications
Each alert wears one pattern badge. The user-visible patterns:
| Badge | What it means |
|---|---|
| Aggressive Call / Aggressive Put | Paying up at or above the ask for direction |
| Consistent Call / Consistent Put | The same trade signature recurring within a short window |
| Large Call | One outsized call purchase worth a look on its own |
| Whale Trade | Very large single-name premium |
| Repeated Activity | The same contract printing again and again |
| Volume Spike | Volume that stands out against open interest or the norm |
| Volatility Spike | Implied-volatility expansion alongside the activity |
| Short-term | Low-DTE positioning with size—often into an imminent event |
Rows can also carry an Opening badge when the size exceeded prior open interest. The exact mix adapts by symbol and market conditions: a print that is routine for a mega-cap may be exceptional for a smaller name.
Unusual Score
The unusual score runs from 0 to 100 and is a relative priority indicator, not a probability of profit. Use the score filter (70+, 80+, 90+) to keep only the loudest events, and read the score together with premium, expiration, volume/open interest, execution side, related legs, news, and the symbol’s normal behavior.
Live stream, time travel, and saved views
- Pause / Play stops the stream; a badge counts alerts that arrived while paused, and resuming reloads to fill the gap.
- The date selector (Time Travel) replays a prior session’s alerts.
- Saved Views store a filter combination under a name for one-click reuse.
Filters
Quick filters: High Score, Whale Trades, Volume Spikes, Aggressive Buying, and No ETFs (hide index/ETF flow to focus on single names).
- Basic: alert type (the pattern list above), calls/puts, symbol, execution side, unusual score threshold, premium range.
- Advanced: minimum size, volume, and open interest; strike and DTE ranges; IV range; a generated-after time.
Important Context
Not all unusual activity is directional. A high score means the activity deserves attention; it does not mean the buyer or seller will be right.
- A large put buy may hedge a long stock book, an index portfolio, or a short call position—not a simple bearish bet on the name.
- A large sale at the bid can be closing a long, opening a short, or unwinding one leg of a spread; the tape alone rarely proves which.
- You typically see one contract line; multi-leg packages may not resolve into a single clean narrative without chain and time context.
- ETFs and indices often dominate flow for macro hedging; the No ETFs filter exists so you can focus on single names when that matches your process.
Always cross-check: the corporate calendar (earnings, dividends, splits), headlines, key prices from gamma exposure or your own levels, and whether realized vol is expanding or compressing.
Remember: Unusual activity is market intelligence, not a trading signal. Use it to ask better questions and allocate attention; combine it with risk limits, position sizing, and your own thesis before committing capital.
