Gamma Exposure (GEX)
Modeled option exposure by strike
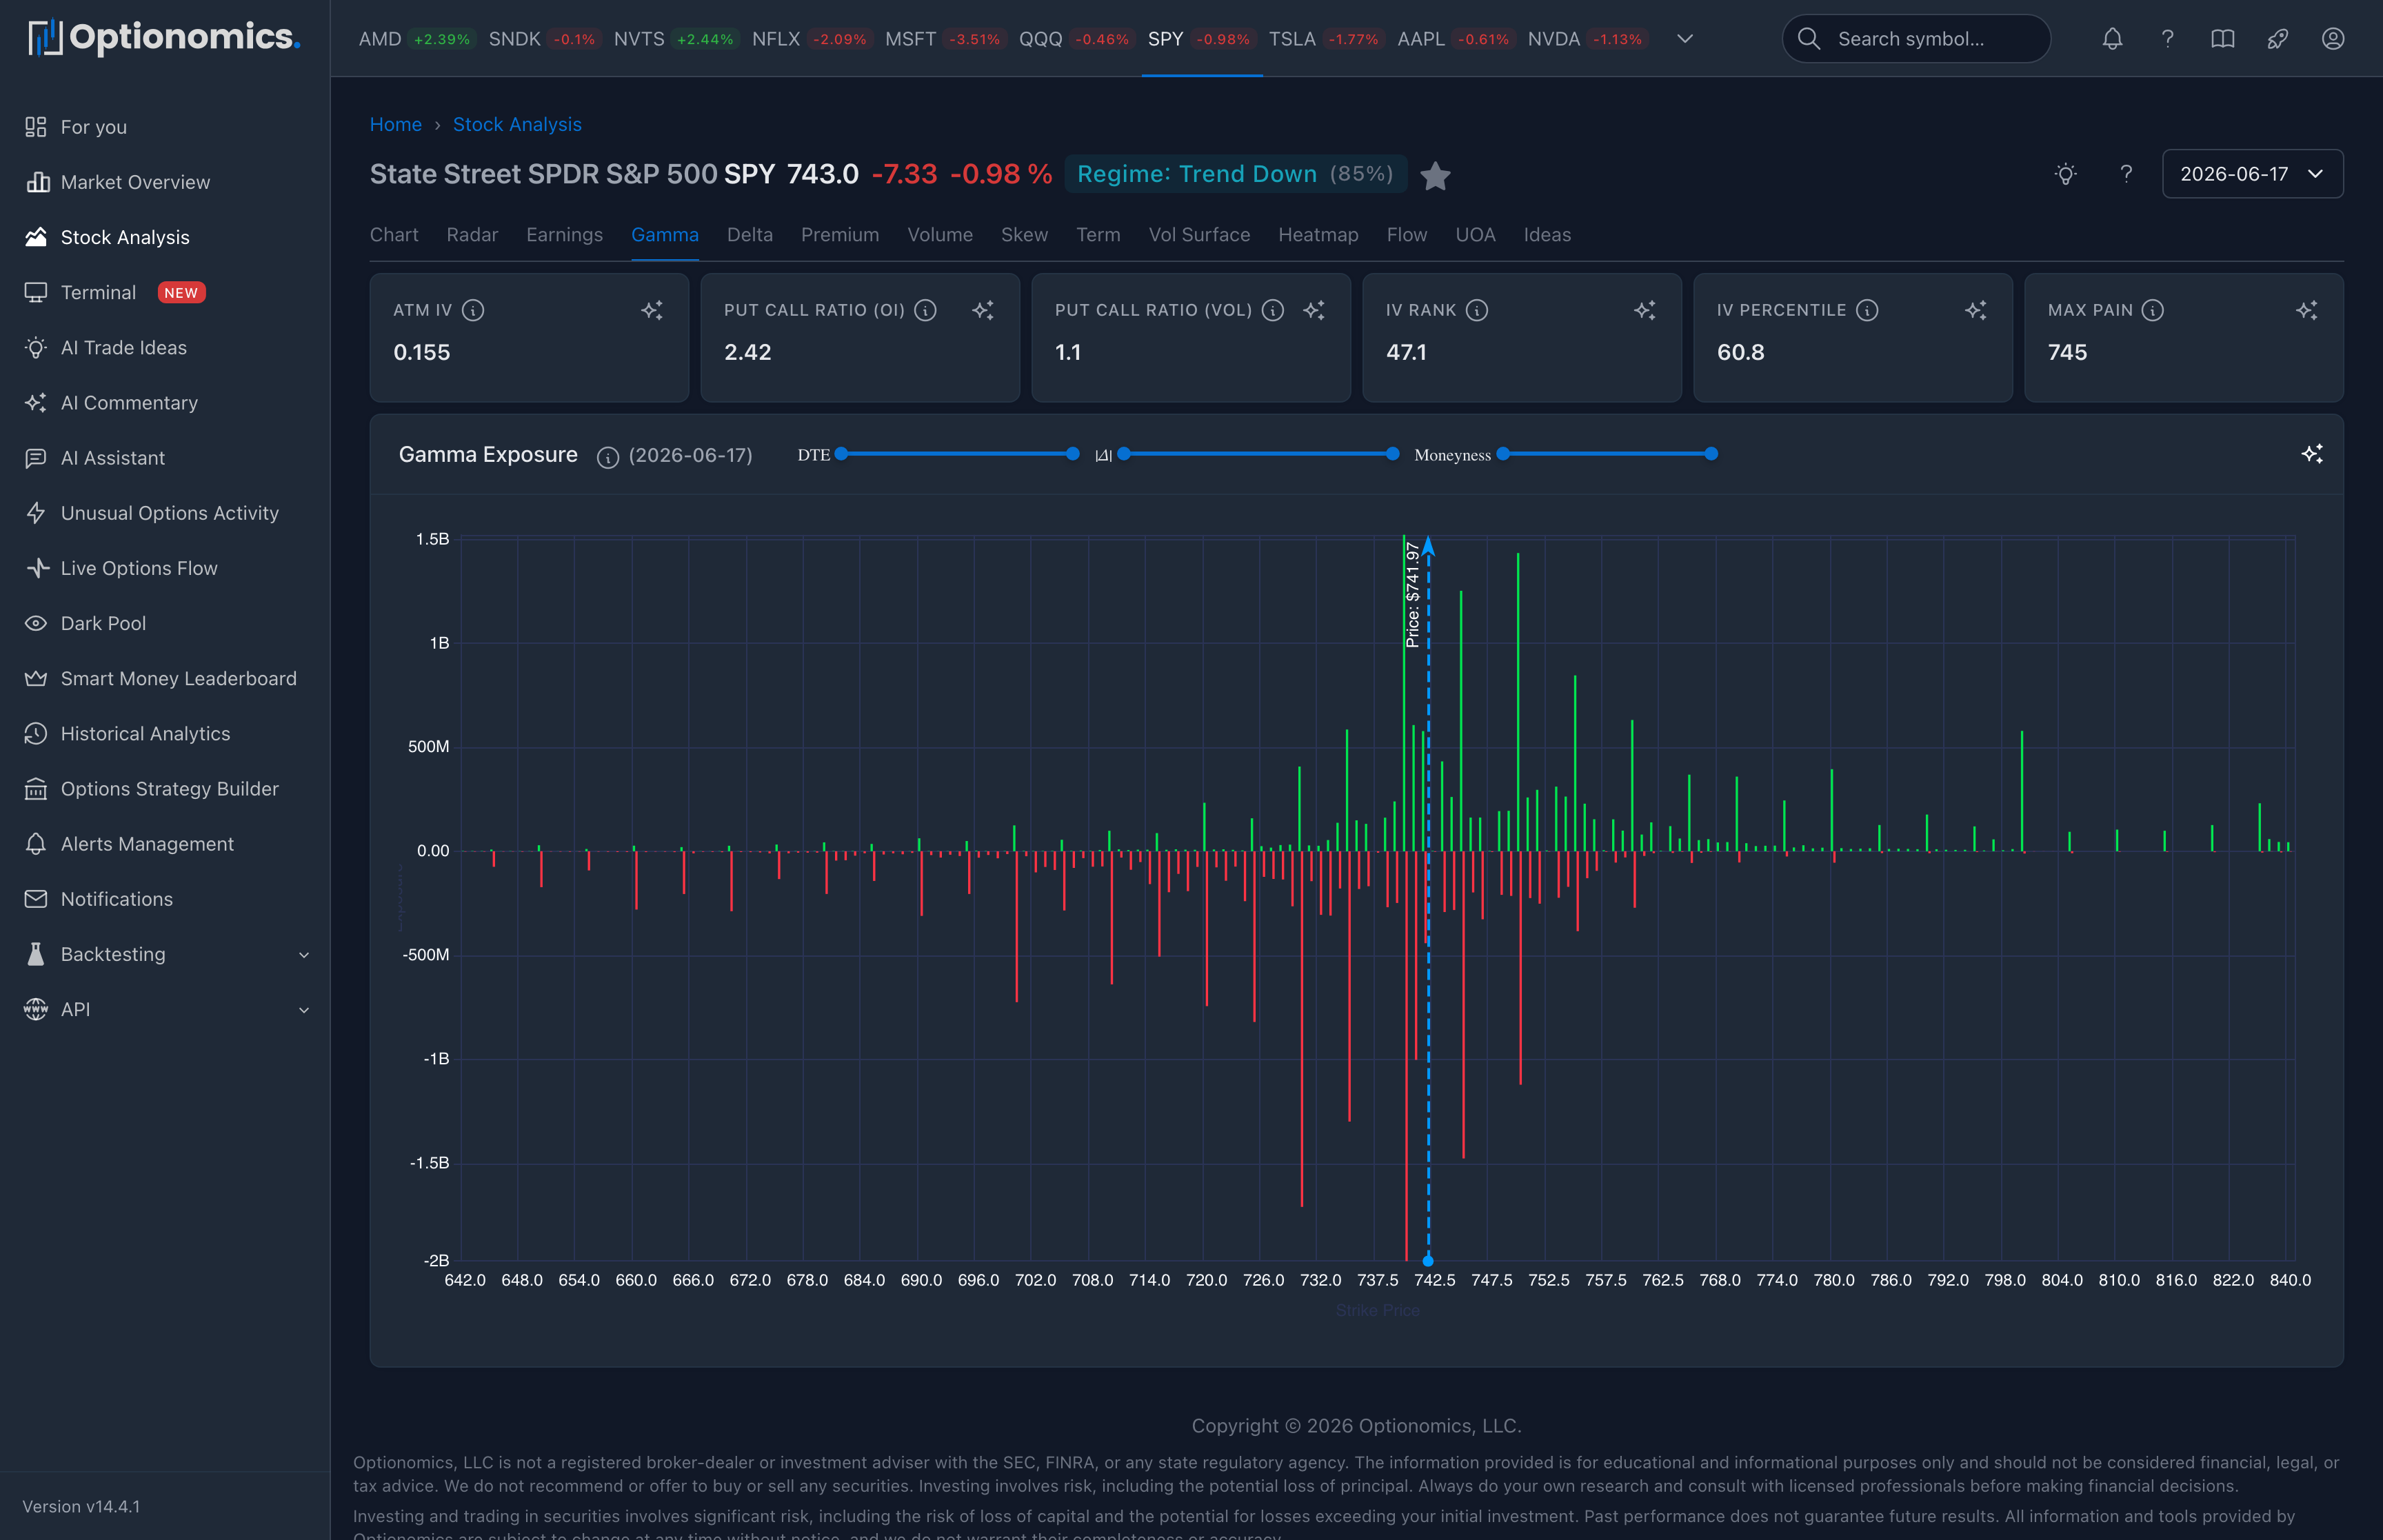
What the Gamma tab shows
Gamma Exposure (GEX) summarizes modeled option gamma across strikes for the selected symbol and trading-date snapshot. It helps you see where the chain’s sensitivity to stock-price movement is concentrated.
Availability: Delta plan and higher.
Open it: Search for a symbol, open the Stock Workspace, and choose Gamma.
How to read the chart
- Bars show modeled gamma exposure at each strike under the chart’s displayed sign convention.
- Taller bars represent larger exposure estimates in the selected chain and filters.
- The current-price marker shows where the stock sits relative to those concentrations.
- A change in the aggregate sign can provide context for a different hedging-sensitivity regime.
GEX is an estimate, not a view into every market participant’s inventory. The chart cannot confirm who owns each contract, whether a position is opening or closing, or how a dealer is hedged outside the displayed chain.
Positive and negative regimes
| Reading | Possible context |
|---|---|
| Positive aggregate GEX | Hedging flows may dampen movement under some conditions, which can support more range-bound behavior |
| Negative aggregate GEX | Hedging flows may amplify movement under some conditions, which can support faster or more directional behavior |
| Near a sign change | The modeled balance is less one-sided and may be more sensitive to price, time, and new activity |
These are possible mechanisms, not predictions. News, stock volume, expiration, volatility, and positioning outside the dataset can dominate the effect.
Strike concentrations
The page can identify prominent call-side, put-side, or sign-change levels from the displayed exposure. Treat them as areas to investigate:
- Compare the strike with current price and the nearest expirations.
- Check whether Volume Distribution and Premium Distribution show a similar concentration.
- Open Options Flow to see whether recent activity supports or challenges the snapshot.
- Use Time Travel to see whether the concentration persisted or moved.
A large bar is not guaranteed support, resistance, or a price magnet.
Filters
Use the visible DTE, delta, moneyness, and strike controls to isolate the part of the chain relevant to your question. Apply the same filter set when comparing Gamma with Delta, Premium, or Volume so the charts represent a similar contract universe.
Practical workflow
- Start with the full available chain to identify the broad regime and largest concentrations.
- Narrow to the expiration window relevant to your trade horizon.
- Compare the result with price, flow, and the Chain Heatmap.
- Move the date selector to a prior session to see whether exposure changed with price and time.
- Re-check after large option activity or expiration because the snapshot can change materially.
Gamma exposure is market context, not a trading instruction. Use it alongside liquidity, event risk, and your own risk limits.
