Thank you for signing up! In this guide, we’ll show you the basics of the Optionomics platform and help you get started with options analysis.
Important Disclaimer
Before we begin, please remember that nothing on this platform should be considered an automatic buy or sell signal. Optionomics is a research and analysis tool designed to help you make informed decisions.
If you’re new to trading or the options market, we strongly recommend taking time to build your knowledge first. There’s no rush—if you need more time to learn, please contact us and we’ll provide a refund. We’ll be here when you’re ready.
Platform Navigation
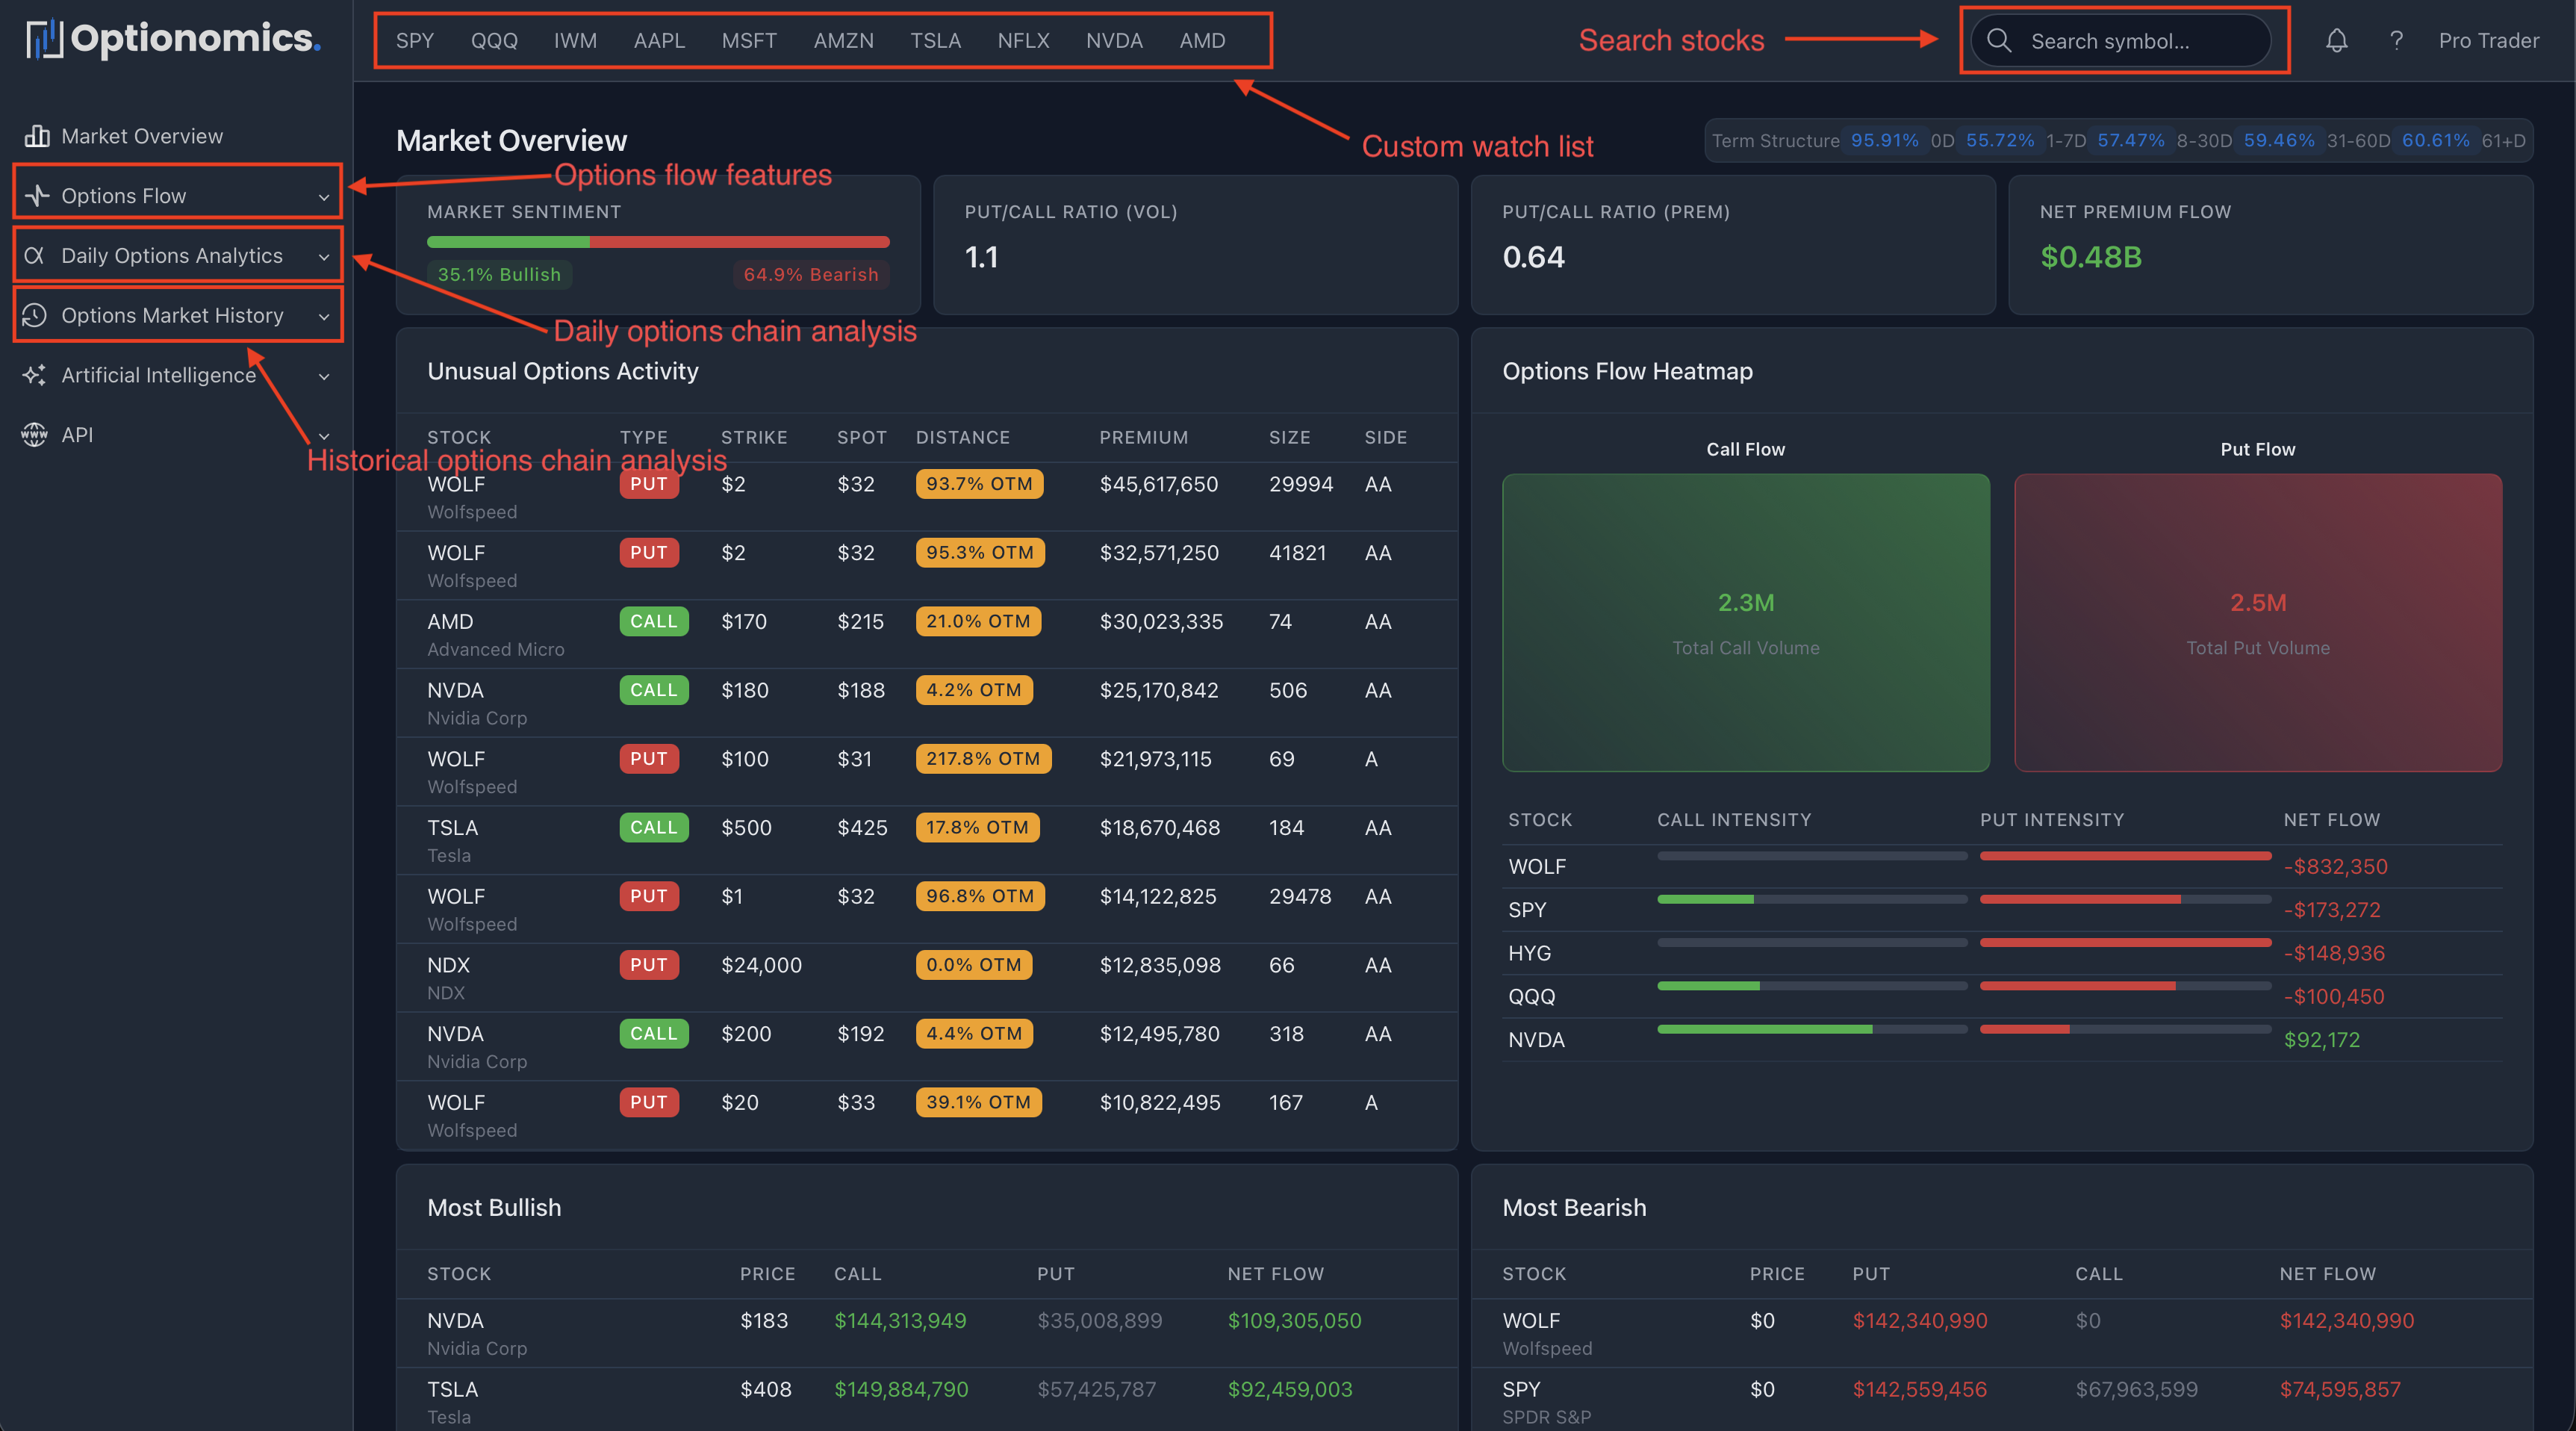
Let’s explore the basic navigation and key features of the Optionomics platform.
Watchlist
At the top of the page, you’ll find your watchlist—a customizable collection of your favorite stocks. The platform provides a default set of popular stocks to get you started, but you can easily customize this list to match your trading interests.
Key Feature: The watchlist is context-aware, remembering both the page you’re viewing and the selected date, making navigation seamless as you analyze different stocks.
Search Box
Use the search functionality to quickly find any stock symbol. The search feature is also context-aware, maintaining your current page settings and selected date when you switch between stocks.
Time Travel
One of Optionomics’ most powerful features is the ability to analyze historical data. Most feature pages include a date selector dropdown that allows you to travel back in time and see exactly how the data appeared on any past date. This is invaluable for:
- Backtesting trading strategies
- Understanding historical market patterns
- Learning from past unusual activity
- Analyzing how options metrics evolved over time
Core Analytics Features
Optionomics organizes its analytics into three main categories, each designed to provide unique insights into options market activity:
1. Options Flow
These features analyze real-time options flow data, tracking institutional trades as they happen. Options flow tools help you:
- Identify unusual options activity
- Track smart money movements
- Monitor real-time trade execution and volume
- Spot potential market-moving trades
Best for: Day traders and active traders who want to follow the action in real-time.
2. Daily Options Analysis
These features utilize current or selected date option chain data to provide comprehensive analysis of:
- Gamma exposure (GEX) and dealer positioning
- Options walls and support/resistance levels
- Put/Call ratios and sentiment indicators
- Max pain analysis
- Implied volatility metrics
Best for: Swing traders and options sellers who focus on positioning and volatility.
3. Options Market History
Access historical options chain data to understand long-term trends and patterns. These features let you:
- Analyze how options metrics evolved over time
- Study historical volatility patterns
- Research past options chain metrics and their market impact
Best for: Quantitative traders and researchers conducting in-depth analysis.
4. Advanced Features
Beyond the core analytics, we offer powerful advanced capabilities:
- AI-Powered Insights: Get intelligent analysis of metrics and data
- Custom Alerts: Set up personalized notifications for specific market conditions
We’ll cover these features in dedicated guides.
Need Help?
If you have questions or need assistance:
- Email: support@optionomics.ai
- Documentation: Browse our comprehensive documentation and guides
- In-Platform Help: Look for the (?) icon throughout the platform
Remember: Options trading involves substantial risk. Always do your own research and never risk more than you can afford to lose. Use Optionomics as one tool in your trading arsenal, not as a sole decision-making source.
Last updated: October 2025