In this guide, we’ll help you understand and effectively use the live options flow data to identify institutional trading activity and potential market-moving trades.
What is Options Flow?
Options flow refers to the real-time stream of options transactions as they occur in the market. Every time someone buys or sells an options contract, that trade is recorded and disseminated. By analyzing this flow of trades, we can:
- Track Smart Money: Identify large institutional trades and follow where the big players are positioning
- Spot Unusual Activity: Detect trades that are significantly larger or more unusual than typical activity
- Gauge Market Sentiment: Understand whether traders are positioning bullish (calls) or bearish (puts)
- Identify Potential Catalysts: Large trades often precede significant price movements
Why Options Flow Matters
Unlike stock trades, options trades reveal directional intent and time expectations. When an institution buys a large call position, they’re not just betting on upward movement—they’re betting on it happening before expiration. This makes options flow particularly valuable for:
- Day Trading: Real-time alerts for immediate opportunities
- Swing Trading: Understanding multi-day positioning changes
- Risk Management: Spotting when sentiment shifts
- Trade Ideas: Following institutional money flow
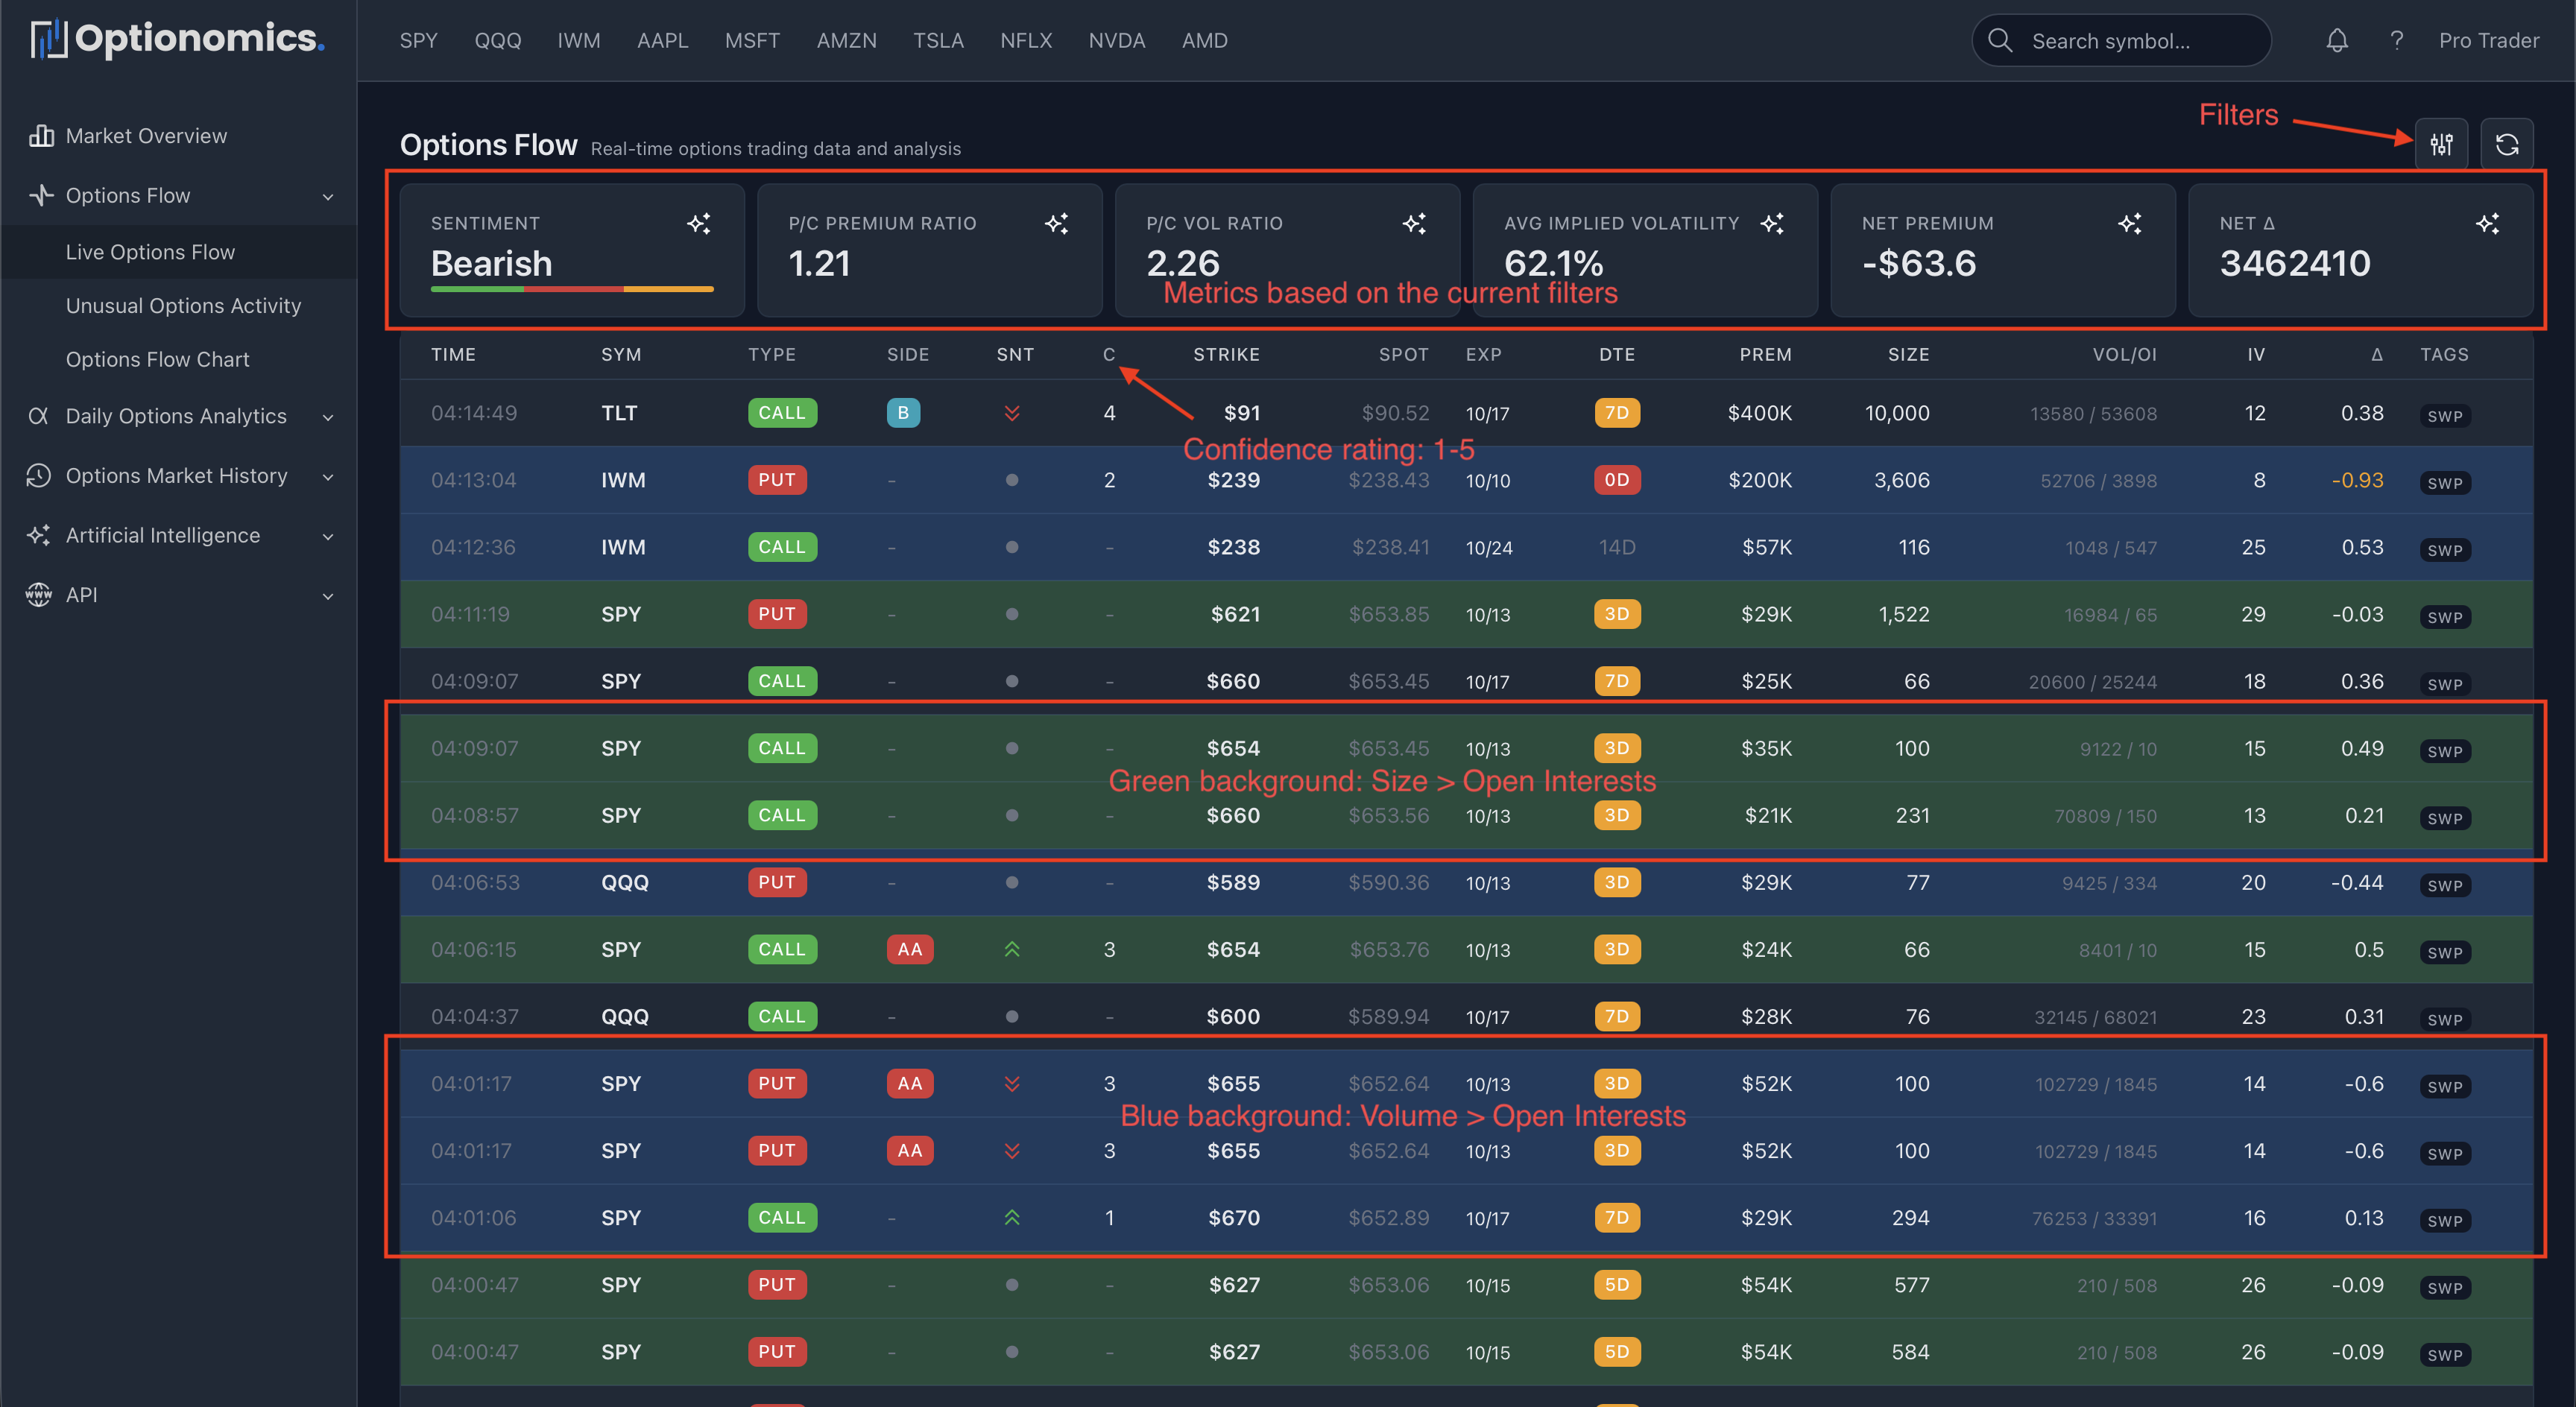
Using Filters
The filter panel allows you to customize your flow view to match your trading strategy. Click the Filter button (funnel icon) in the top right to access filtering options.
The filter modal has three tabs:
- Basic - Core filters for most users
- Advanced - Market quality and volume filters
- Greeks - Greek-based filtering for advanced traders
Quick Filter Buttons
At the top of the Basic tab, you’ll find one-click preset filters:
- Smart Money: Sweeps + Premium ≥ $100K
- Whales: Premium ≥ $500K (massive trades)
- 0DTE: Trades expiring today
- Institutional: Likely institutional activity
Understanding Trade Details
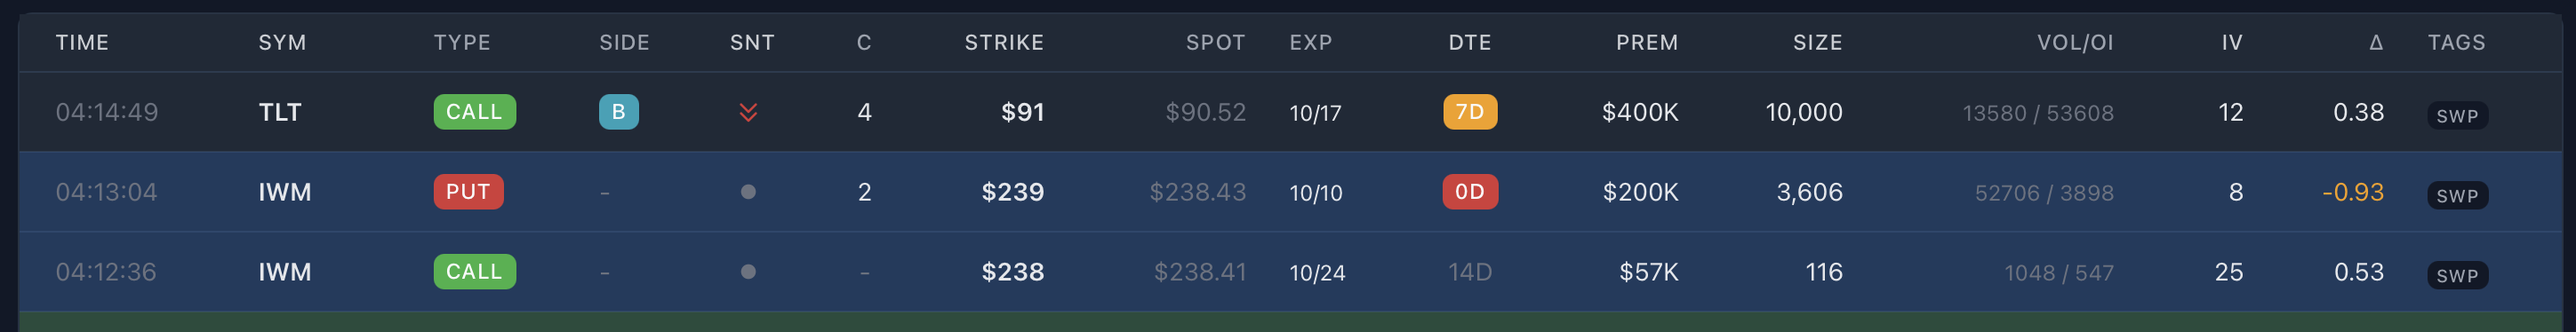 Time - Exact timestamp of trade execution
Sym - The underlying stock ticker
Type - Call or Put
Side - Execution side indicator
- B (blue badge): At bid (aggressive sell)
- AA (red badge): Above ask (very aggressive buy)
- A: At ask (aggressive buy)
- M: Mid-market (neutral)
- Up arrow (↑): Buyer aggression
- Down arrow (↓): Seller aggression
Snt - Sentiment rating (1-4 scale)
- 1: Strongly bearish
- 2: Bearish
- 3: Bullish
- 4: Strongly bullish
C - Confidence rating (1-5 scale)
- 1: Low confidence
- 5: High confidence
- Higher = more reliable signal
Strike - The strike price of the option
Spot - Current underlying stock price
Exp - Expiration date
DTE - Days To Expiration
Prem - Total premium (dollar amount)
Size - Number of contracts traded
Vol/OI - Volume and Open Interest
IV - Implied Volatility (as percentage)
Δ - Delta (Greek)
Tags - Trade characteristics
- swp: Sweep trade (aggressive multi-exchange)
- blk: Block trade (large institutional)
- iso: Intermarket Sweep Order
- Multiple tags can appear on same trade
Reading the Flow: Practical Examples
Example 1: Bullish Sweep
AAPL CALL $150 11/15/24 Price: $2.50 Size: 500 Premium: $125,000 Side: ASK Type: SWEEP
Interpretation:
- Large aggressive call purchase ($125K)
- Sweep = high urgency
- At ask = willing to pay up
- Near-term expiration (likely weekly)
- Signal: Strong bullish conviction on AAPL
Example 2: Protective Put Purchase
TSLA PUT $200 12/20/24 Price: $8.00 Size: 1,000 Premium: $800,000 Side: ASK Type: BLOCK
Interpretation:
- Very large put purchase
- Block trade = institutional
- Out-of-the-money strike
- Longer-term expiration
- Signal: Downside hedging or bearish position
Example 3: Call Selling
SPY CALL $460 11/08/24 Price: $1.20 Size: 2,000 Premium: $240,000 Side: BID Type: SWEEP
Interpretation:
- Large call sale
- Near-term expiration
- At bid = aggressive exit
- Signal: Taking profits or bearish shift
Understanding Execution Side
Remember the trader’s perspective:
- Buying at ask = paying more, bullish urgency
- Selling at bid = accepting less, bearish urgency
- For calls: Ask = bullish, Bid = bearish
- For puts: Ask = bearish, Bid = bullish
Remember: Options flow shows you what traders are doing, not what will happen. Use it as one tool in your analysis toolkit, always consider context, and practice proper risk management.
Last updated: October 2025