The Options Flow Chart is one of the most powerful visualizations on the Optionomics platform. It combines real-time stock price movement with options flow data, showing you exactly where smart money is positioning as the stock moves. This guide will teach you how to read every element of this chart and use it effectively in your trading.
What is the Options Flow Chart?
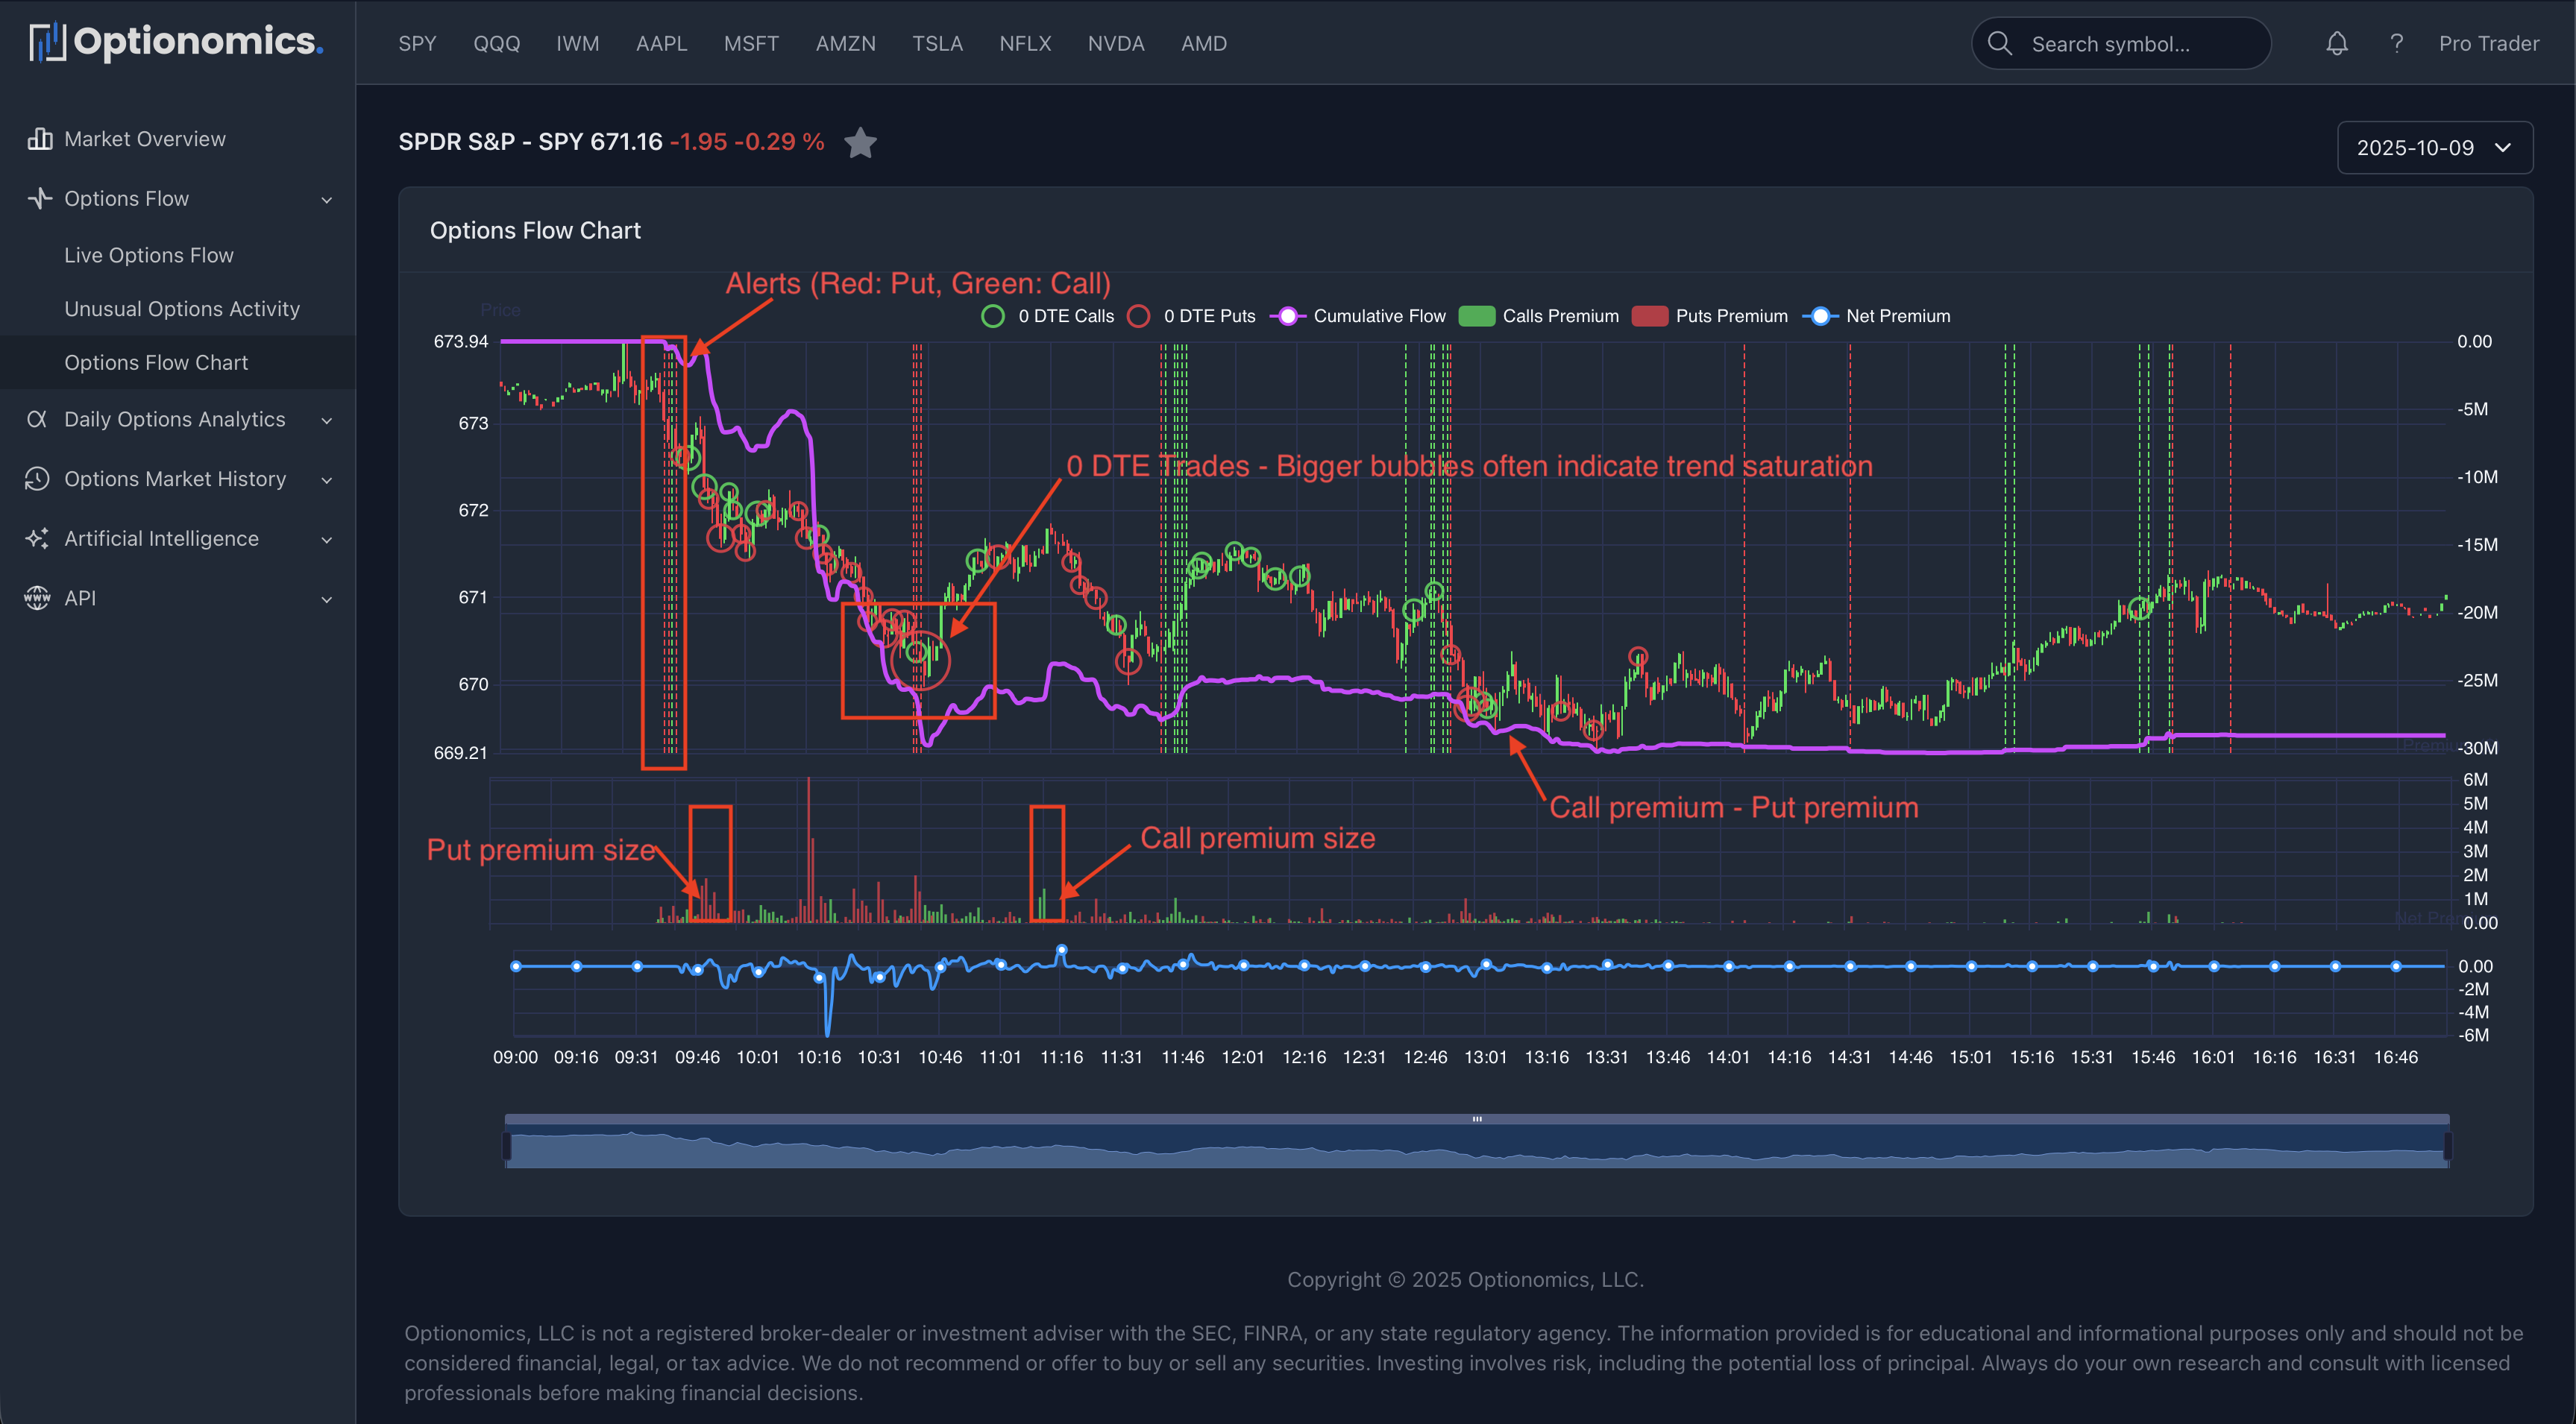
The Options Flow Chart is an intraday candlestick chart that displays:
- Stock Price Action: Candlestick bars showing intraday price movement
- Call Premium Flow: Green area showing aggressive call buying (at or above ask)
- Put Premium Flow: Red area showing aggressive put buying (at or above ask)
- Net Premium Flow: Line showing the balance between calls and puts
- 0DTE Trades: Bubbles highlighting significant same-day expiration trades
- Alert Markers: Vertical lines marking unusual activity events
Understanding Each Component
1. Stock Price Candlesticks
The candlesticks show traditional intraday price action:
Why it matters: The candlesticks give you context for the options flow. Are options traders positioning with or against the stock’s movement?
2. Call Premium Flow (Green Area/Line)
The green shaded area or line represents aggressive call buying:
What it shows:
- Total dollar premium spent on calls bought at or above ask price
- Cumulative or grouped by time period
- Only includes aggressive buys (not passive orders)
3. Put Premium Flow (Red Area/Line)
The red shaded area or line represents aggressive put buying:
What it shows:
- Total dollar premium spent on puts bought at or above ask price
- Same aggressive buying criteria as calls
- Often represents hedging or bearish positioning
4. Net Premium Flow Line
The net premium line shows the balance between call and put buying:
Calculation: Call Premium - Put Premium
Positive (above zero) = Net call buying
- More money flowing into calls than puts
- Bullish sentiment outweighing bearish
- Often aligns with upward price movement
Negative (below zero) = Net put buying
- More money flowing into puts than calls
- Bearish sentiment or strong hedging activity
- May indicate defensive positioning
5. 0DTE Trade Bubbles
Bubbles on the chart represent significant same-day expiration (0DTE) trades:
What they show:
- Large premium trades expiring that same day
- Bubble size = premium size
- Bubble position = time and price level of execution
- Color = call (green) or put (red)
6. Alert Markers (Vertical Lines)
Vertical lines mark moments when unusual activity alerts were triggered:
What they indicate:
- Trades that met unusual activity criteria
- Significant institutional flow detected
- High-confidence score events (typically 70+)
Remember: Options flow shows you where smart money is positioning, but it’s not a guarantee of future movement. Always practice proper risk management, use stop losses, and never bet more than you can afford to lose.
Last updated: October 2025