History doesn’t repeat itself, but it often rhymes. Options Market History gives you access to over 15 years of options data, allowing you to study past patterns, and learn from what actually happened. This guide will teach you how to use historical analytics to become a better trader by learning from the market’s history.
What is Options Market History?
Options Market History is our collection of 11 specialized charts that track options metrics over time. Unlike daily analytics (which show today’s positioning) or options flow (which shows real-time trades), historical analytics show how metrics evolved over time.
The Power of Time Travel
One of Optionomics’ most unique features is Time Travel—the ability to go back to any historical date and see exactly what the data looked like on that day.
The 11 Historical Charts
Let’s explore each chart and how to use it:
1. Volatility Metrics
Tracks implied volatility levels (30-day IV, 60-day IV, IV Rank, IV Percentile) and trends over time to show how expensive or cheap options have been historically. High IV Rank (>80) indicates options near yearly highs, signaling opportunities for premium sellers, while low IV Rank (<20) suggests cheap options for buyers. Use this to identify mean reversion opportunities—sell premium when IV is historically high and buy when historically low.
2. Volatility Skew Evolution
Shows how implied volatility varied across different strike prices over time, revealing market fear (put skew) or speculation (call skew) patterns. Steep put skew indicates elevated crash protection pricing, while flat skew often precedes or follows major events like earnings. Use historical skew to identify when tail-risk protection is overpriced (sell OTM puts/calls) or underpriced (buy protection).
3. Greeks History
Tracks aggregate gamma (GEX) and delta exposure across all strikes over time, showing market maker positioning and hedging pressure. Positive GEX historically correlates with range-bound, low-volatility periods, while negative GEX predicts trending, high-volatility moves and potential gamma squeezes. Use gamma flips (positive to negative or vice versa) as regime change signals—trade ranges in positive GEX environments and breakouts in negative GEX periods.
4. Expected Move Analysis
Compares the market’s implied price range (from options pricing) against actual price movement to measure prediction accuracy over time. Historical hit rates typically run 65-70%, but persistent over-prediction (market estimates too high) or under-prediction reveals volatility pricing biases. Use this to identify when to sell options (market consistently overestimates) or buy options (market consistently underestimates movement).
5. Momentum Indicators
Tracks flow momentum, volume momentum, and open interest changes over time to identify trend strength and potential reversals. Building momentum (increasing flow velocity + OI accumulation) often precedes sustained moves, while momentum exhaustion (declining velocity + volume divergence) signals reversals. Study historical momentum scores above 75 to identify trend continuation probabilities and typical exhaustion timeframes for your trading strategy.
6. Max Pain History
Shows the strike price where maximum options value expires worthless over time, representing where market makers theoretically want the stock to close on expiration. Historically, liquid stocks finish within 1% of max pain 40-70% of the time on expiration day, with the effect strengthening Thursday-Friday. Use max pain as a magnet for expiration week trades—sell strangles around max pain or fade extreme deviations, but always account for news catalysts that can override the effect.
7. Sentiment Analysis
Tracks put/call ratios, risk appetite indicators, and sentiment scores to measure market fear and greed over time. Extreme sentiment readings (>90th percentile optimism or <10th percentile pessimism) historically lead to mean reversion within 2-4 weeks about 60-65% of the time. Use sentiment extremes as contrarian indicators—fade excessive optimism (sell calls/buy puts) and fade excessive fear (sell puts/buy calls), especially when diverging from price action.
8. Put/Call Ratios
Measures daily put volume/call volume, put OI/call OI, and put premium/call premium ratios over time as real-time fear/greed indicators. Volume ratios show short-term sentiment, OI ratios reveal sustained positioning, and premium ratios capture institutional money flow. Compare current ratios to historical ranges (study 1-2 years) to identify extreme readings—fade ratios >95th percentile (too bearish) or <5th percentile (too bullish) as contrarian signals.
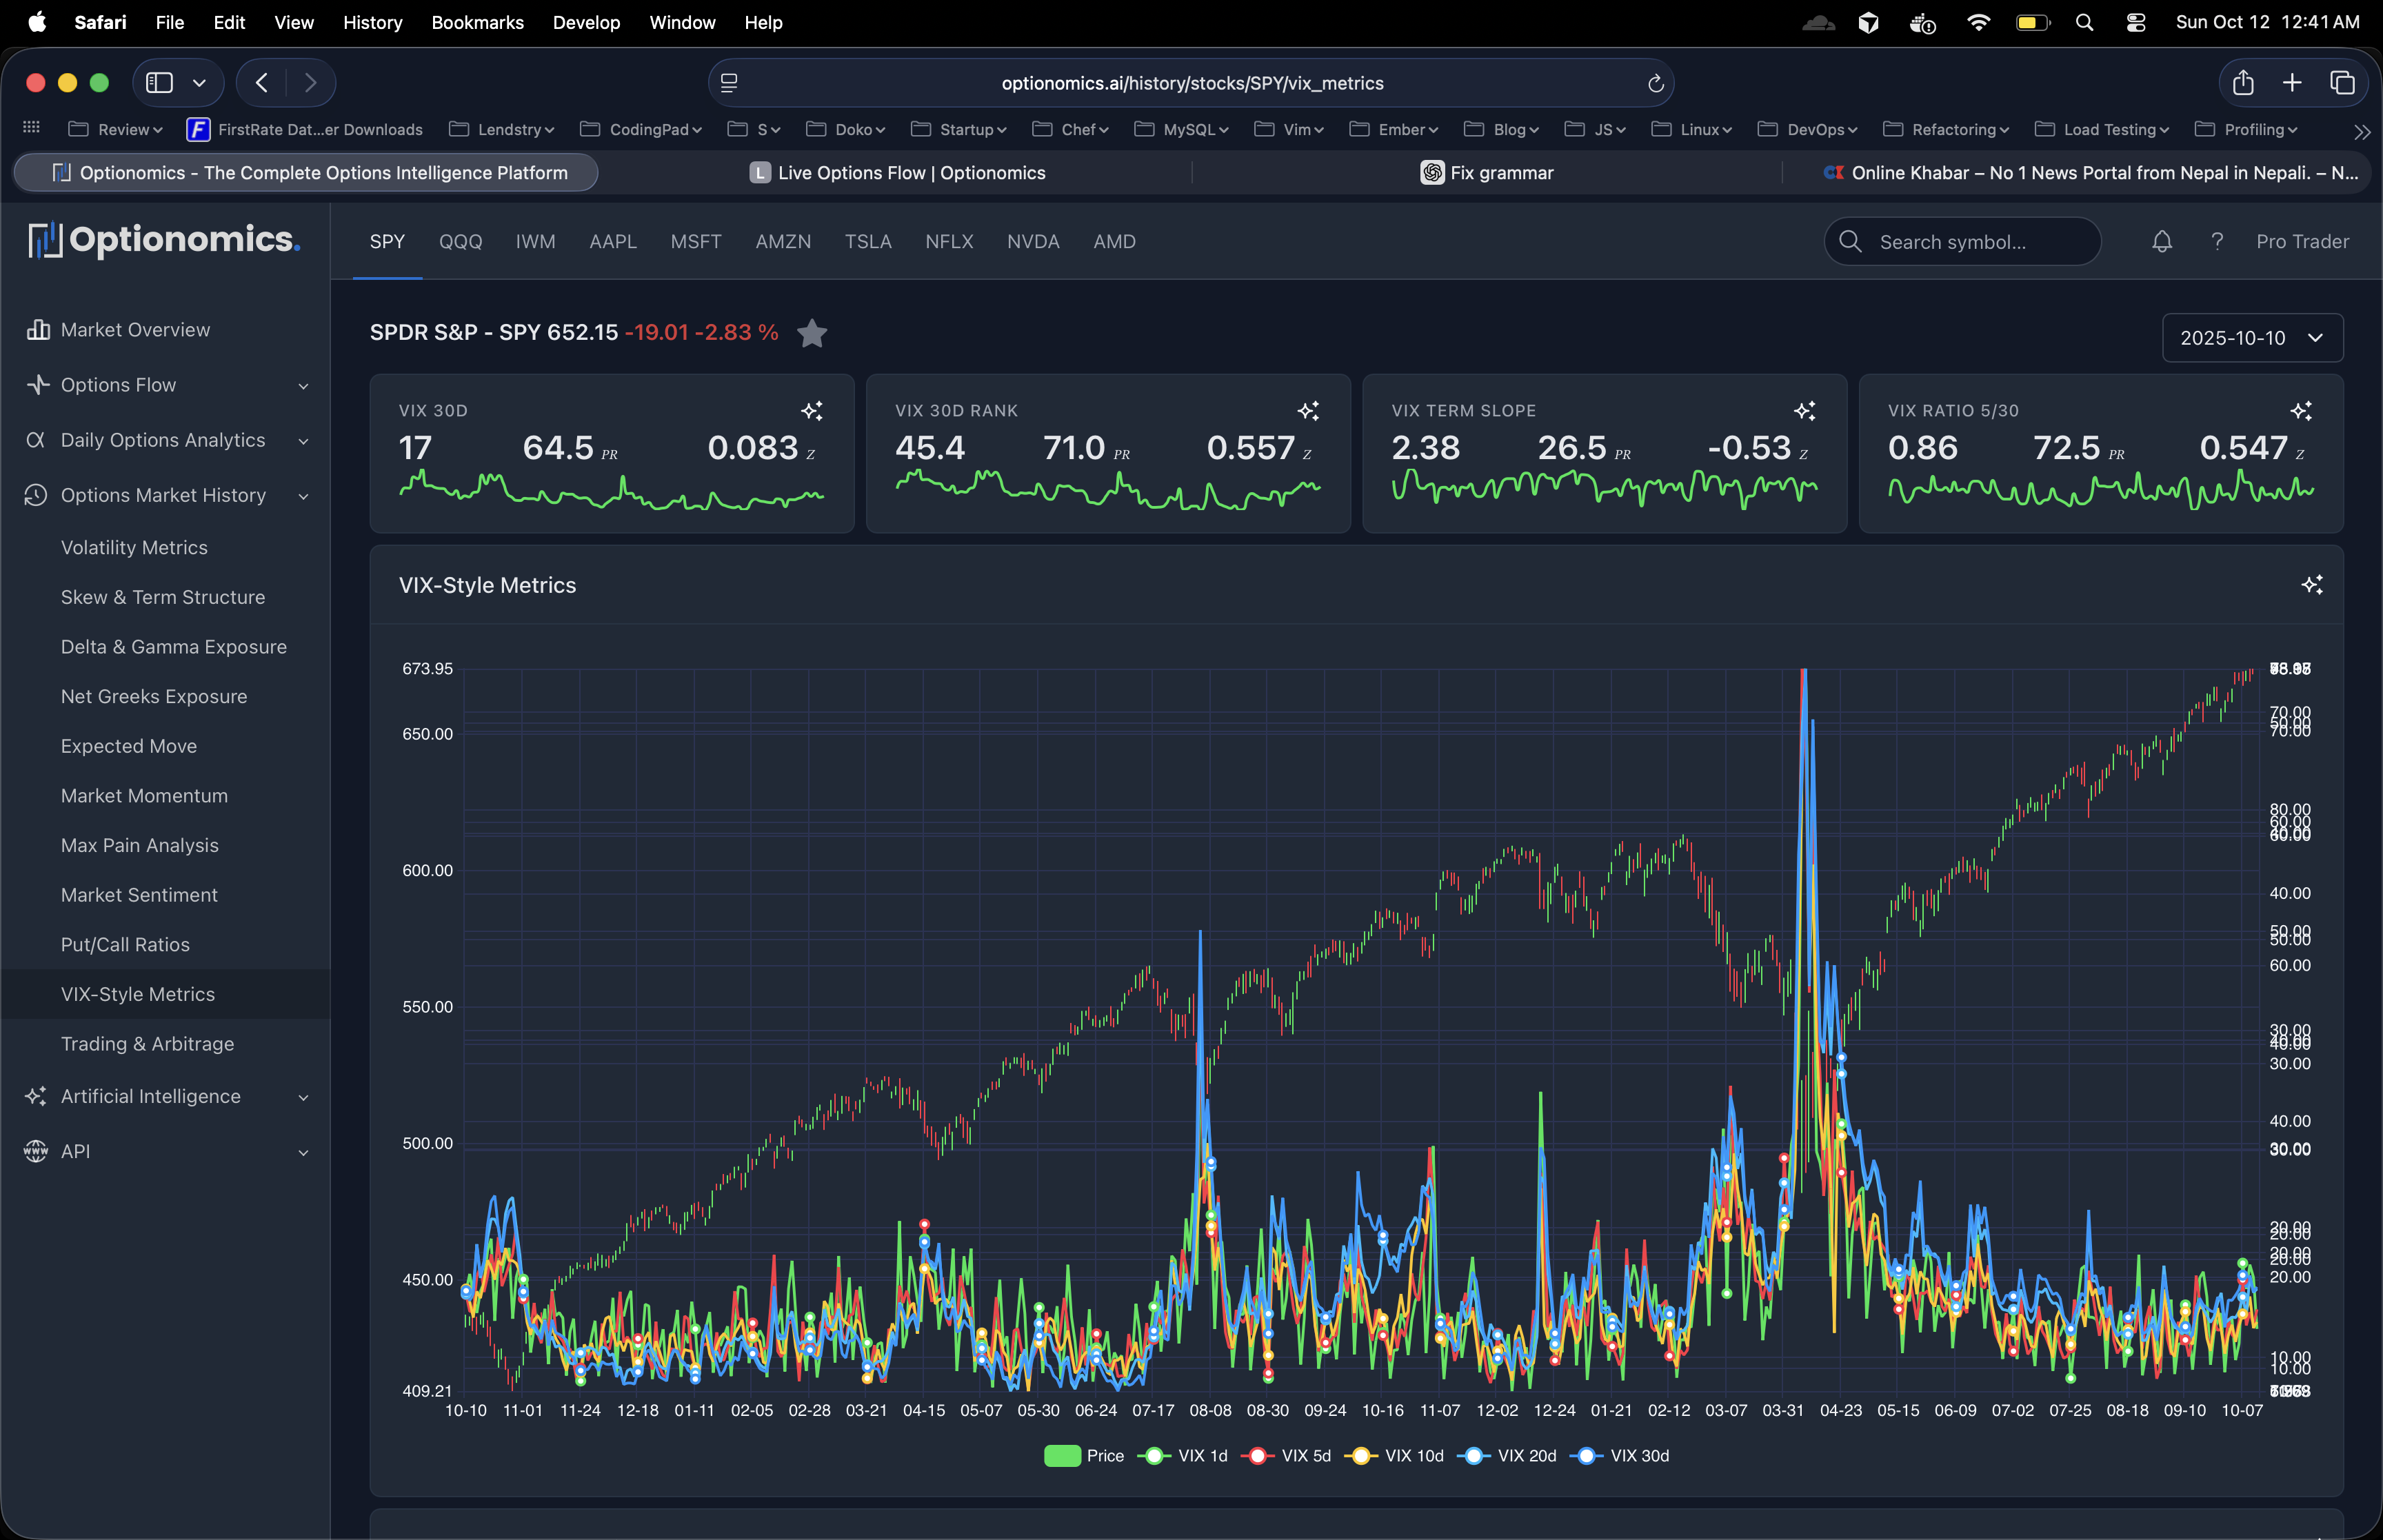
9. VIX Metrics
Calculates VIX-style 30-day expected volatility for individual stocks and tracks volatility term structure (near-term vs far-term volatility) over time. Contango (upward sloping curve) signals normal conditions favorable for calendar spreads, while backwardation (inverted) indicates event risk or crisis. Use term structure patterns to identify calendar spread opportunities in contango and avoid them in backwardation when near-term uncertainty dominates.
10. Net Greeks
Sums all Greeks (Delta, Gamma, Theta, Vega) across the entire options chain over time to reveal aggregate market positioning and exposure. Extreme net delta shows institutional directional bias, extreme net gamma predicts volatility regimes, and shifts in net Greeks often precede major moves. Use extreme net Greek readings historically (>95th percentile) to identify either trend continuation (in trending markets) or exhaustion signals (at market extremes).
11. Trading Patterns
Combines traditional candlestick patterns with options positioning data to validate technical setups—for example, bull flags with call accumulation or support tests with put walls. Options confirmation significantly improves pattern reliability (historical data shows 70% breakout success with call OI vs 50% without). Use this to filter technical patterns—only trade setups where options positioning confirms the price pattern direction.
Remember: Historical patterns are probabilities, not certainties. Markets evolve, and past performance doesn’t guarantee future results. Always use proper risk management, position sizing, and stops.
Last updated: October 2025