Real-Time Options Flow
See every options trade as it happens
Options flow shows you every options trade as it happens. Unlike stock trades, options trades reveal both direction and timing—when someone buys calls expiring next week, they’re betting the stock moves up before expiration.
Availability: Gamma plan and higher ($59/month+)
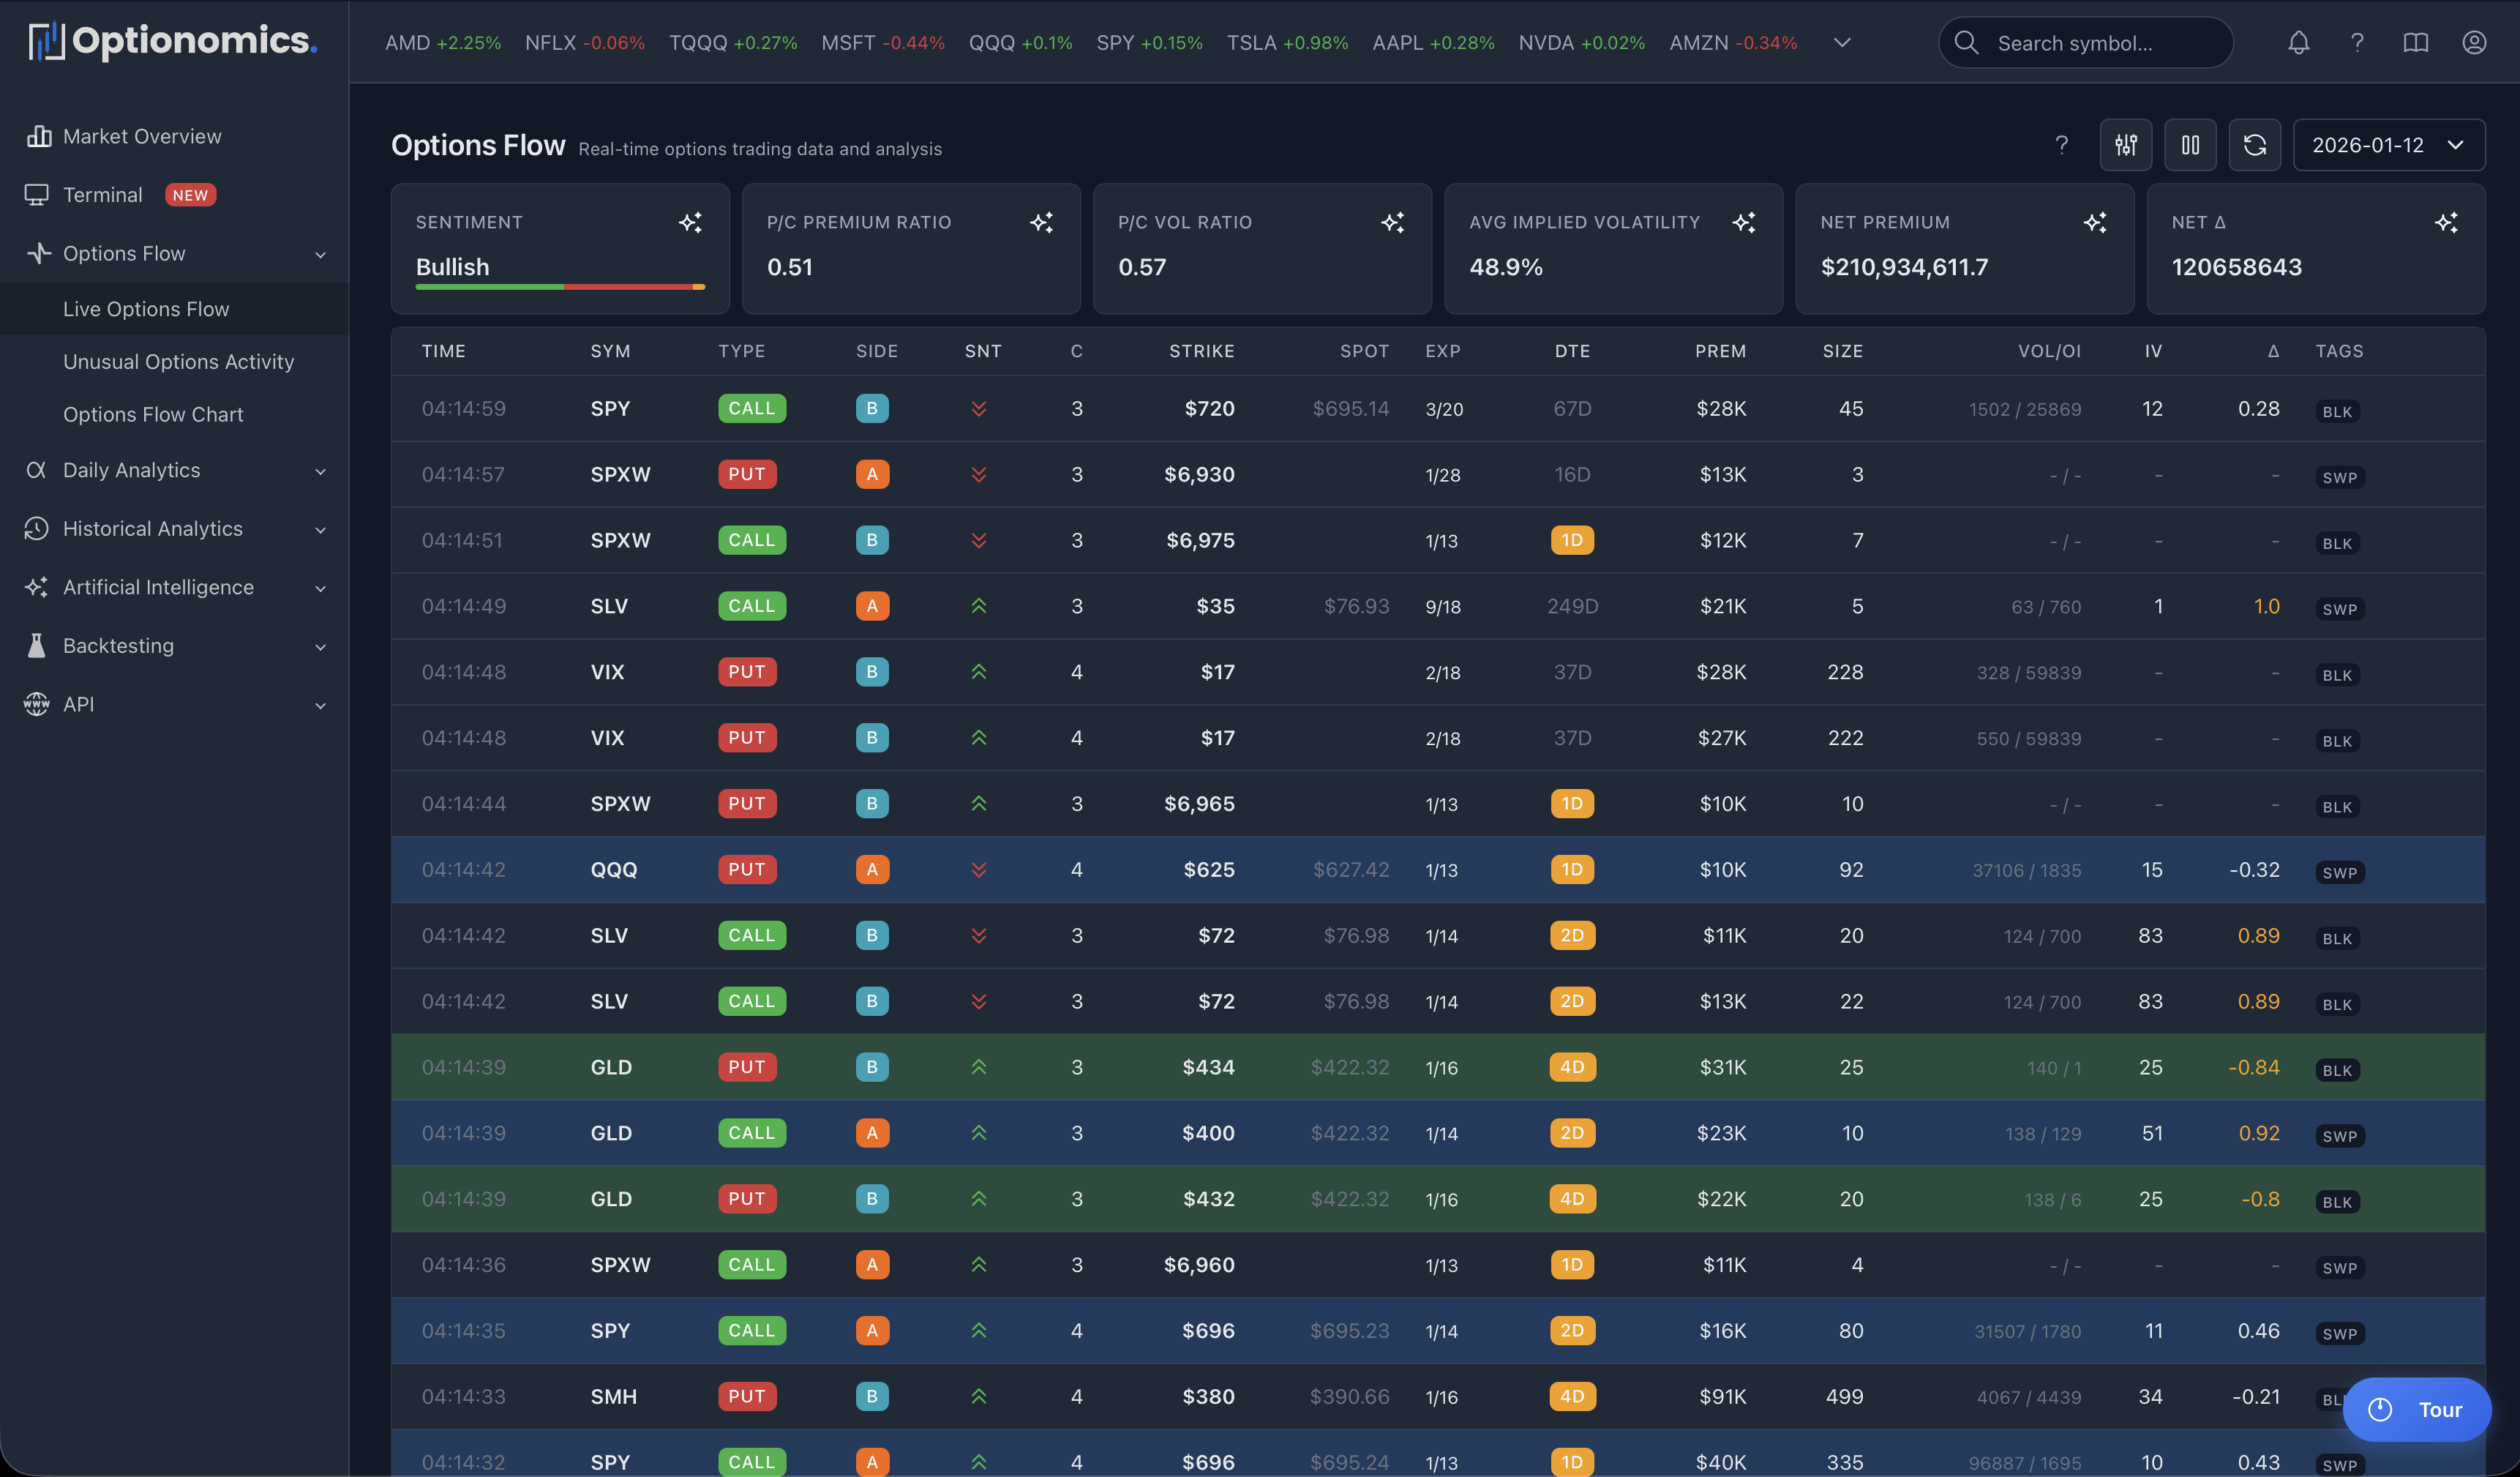
The Flow Table
Each row is a single options trade with these columns:
| Column | What It Tells You |
|---|---|
| Time | When the trade executed |
| Sym | Stock ticker |
| Type | Call or Put |
| Side | Where it traded (AA/A/M/B/BB) |
| Snt | Sentiment (bullish/bearish/neutral) |
| C | Confidence score (1-5) |
| Strike | Option strike price |
| Spot | Current stock price |
| Exp | Expiration date |
| DTE | Days to expiration |
| Prem | Total premium ($) |
| Size | Number of contracts |
| Vol/OI | Volume vs Open Interest |
| IV | Implied volatility |
| Δ | Delta |
| Tags | Sweep, Block, ISO |
Execution Side
The side tells you how aggressively the trade was executed:
| Side | Meaning |
|---|---|
| AA | Above Ask—very aggressive buy |
| A | At Ask—aggressive buy |
| M | Mid-market—neutral |
| B | At Bid—aggressive sell |
| BB | Below Bid—very aggressive sell |
Key insight: Buying at ask (paying more) shows urgency. Selling at bid (accepting less) shows urgency to exit.
Trade Types
Sweeps
Orders that sweep across multiple exchanges to get filled immediately. High urgency, high conviction.
Blocks
Large negotiated trades executed as single transactions. Typically institutional.
ISO (Intermarket Sweep Orders)
Priority orders that cross multiple exchanges simultaneously. Time-sensitive execution.
Dashboard Metrics
At the top of the page, you’ll see aggregated flow data:
| Metric | Description | Interpretation |
|---|---|---|
| Sentiment | Bullish/Bearish/Neutral distribution | % of trades by direction |
| P/C Premium | Put/Call ratio by dollar spent | >1.0 = more $ in puts (bearish) |
| P/C Volume | Put/Call ratio by contracts | >1.0 = more put contracts (bearish) |
| Avg IV | Average implied volatility across trades | Higher = more expensive options |
| Net Premium | Calls minus puts ($ flow) | Positive = net call buying |
| Net Δ | Net delta exposure | Positive = bullish positioning |
| Total Premium | Total $ traded in options | Shows overall activity level |
| Trade Count | Number of trades displayed | Filtered trade count |
Quick Filters
Pre-configured filters for common use cases:
| Filter | Criteria | What It Shows |
|---|---|---|
| Smart Money | Sweeps + $100K+ premium | Urgent, large institutional trades |
| Whales | $500K+ premium OR 1000+ contracts | Massive trades from large players |
| 0DTE | Same-day expiration | High-risk, event-driven gamma plays |
| Institutional | Size ≥100 contracts + premium ≥$50K | Likely institutional activity |
Custom Filters: Create your own filters by combining:
- Symbol, premium range, DTE range
- Trade types (sweep, block, ISO)
- Execution side (AA, A, M, B, BB)
- Volume/OI ratio, unusual score
Reading Flow: Quick Guide
| Signal | Interpretation | Action |
|---|---|---|
| Large premium + Sweep + At Ask | Strong directional conviction | Watch for price follow-through |
| Block trade + Far OTM | Institutional hedge or spec bet | Check for news/catalysts |
| High volume vs OI (>2.0) | New positions being built | Monitor for continued accumulation |
| 0DTE activity | Event-driven or gamma plays | Expect volatility, check calendar |
| Repeated trades same strike | Accumulation or distribution | Look for pattern continuation |
| Sweep + ISO + Above ask | Maximum urgency | Strongest conviction signal |
Premium Size Context
| Premium | Likely Source | Typical Strategy |
|---|---|---|
| >$1M | Hedge funds, institutions | Major positioning, hedging |
| $500K-$1M | Large traders, small funds | Significant directional bets |
| $100K-$500K | Serious retail, small institutions | Swing trades, spreads |
| $25K-$100K | Active retail traders | Day trades, weekly plays |
| <$25K | Retail traders | Speculative, small positions |
Important: Large trades can be:
- Opening new positions (bullish/bearish)
- Closing existing positions (profit-taking, loss-cutting)
- One leg of a spread (incomplete picture)
- Hedges for stock positions (opposite sentiment)
Always consider context: news, technicals, overall flow direction.
Terminal
For power users with focus on day trading, the Terminal provides:
- Multi-panel layout (flow + chart + alerts)
- Advanced charting with indicators
- Real-time flow aggregation by symbol
- Key levels from options positioning
Next: Options Flow Chart — See flow overlaid on price action.
Remember: Flow shows what traders are doing, not what will happen. Large trades can be hedges, spreads, or wrong. Use as one input in your analysis.