Volume Distribution
Option trading activity across strikes
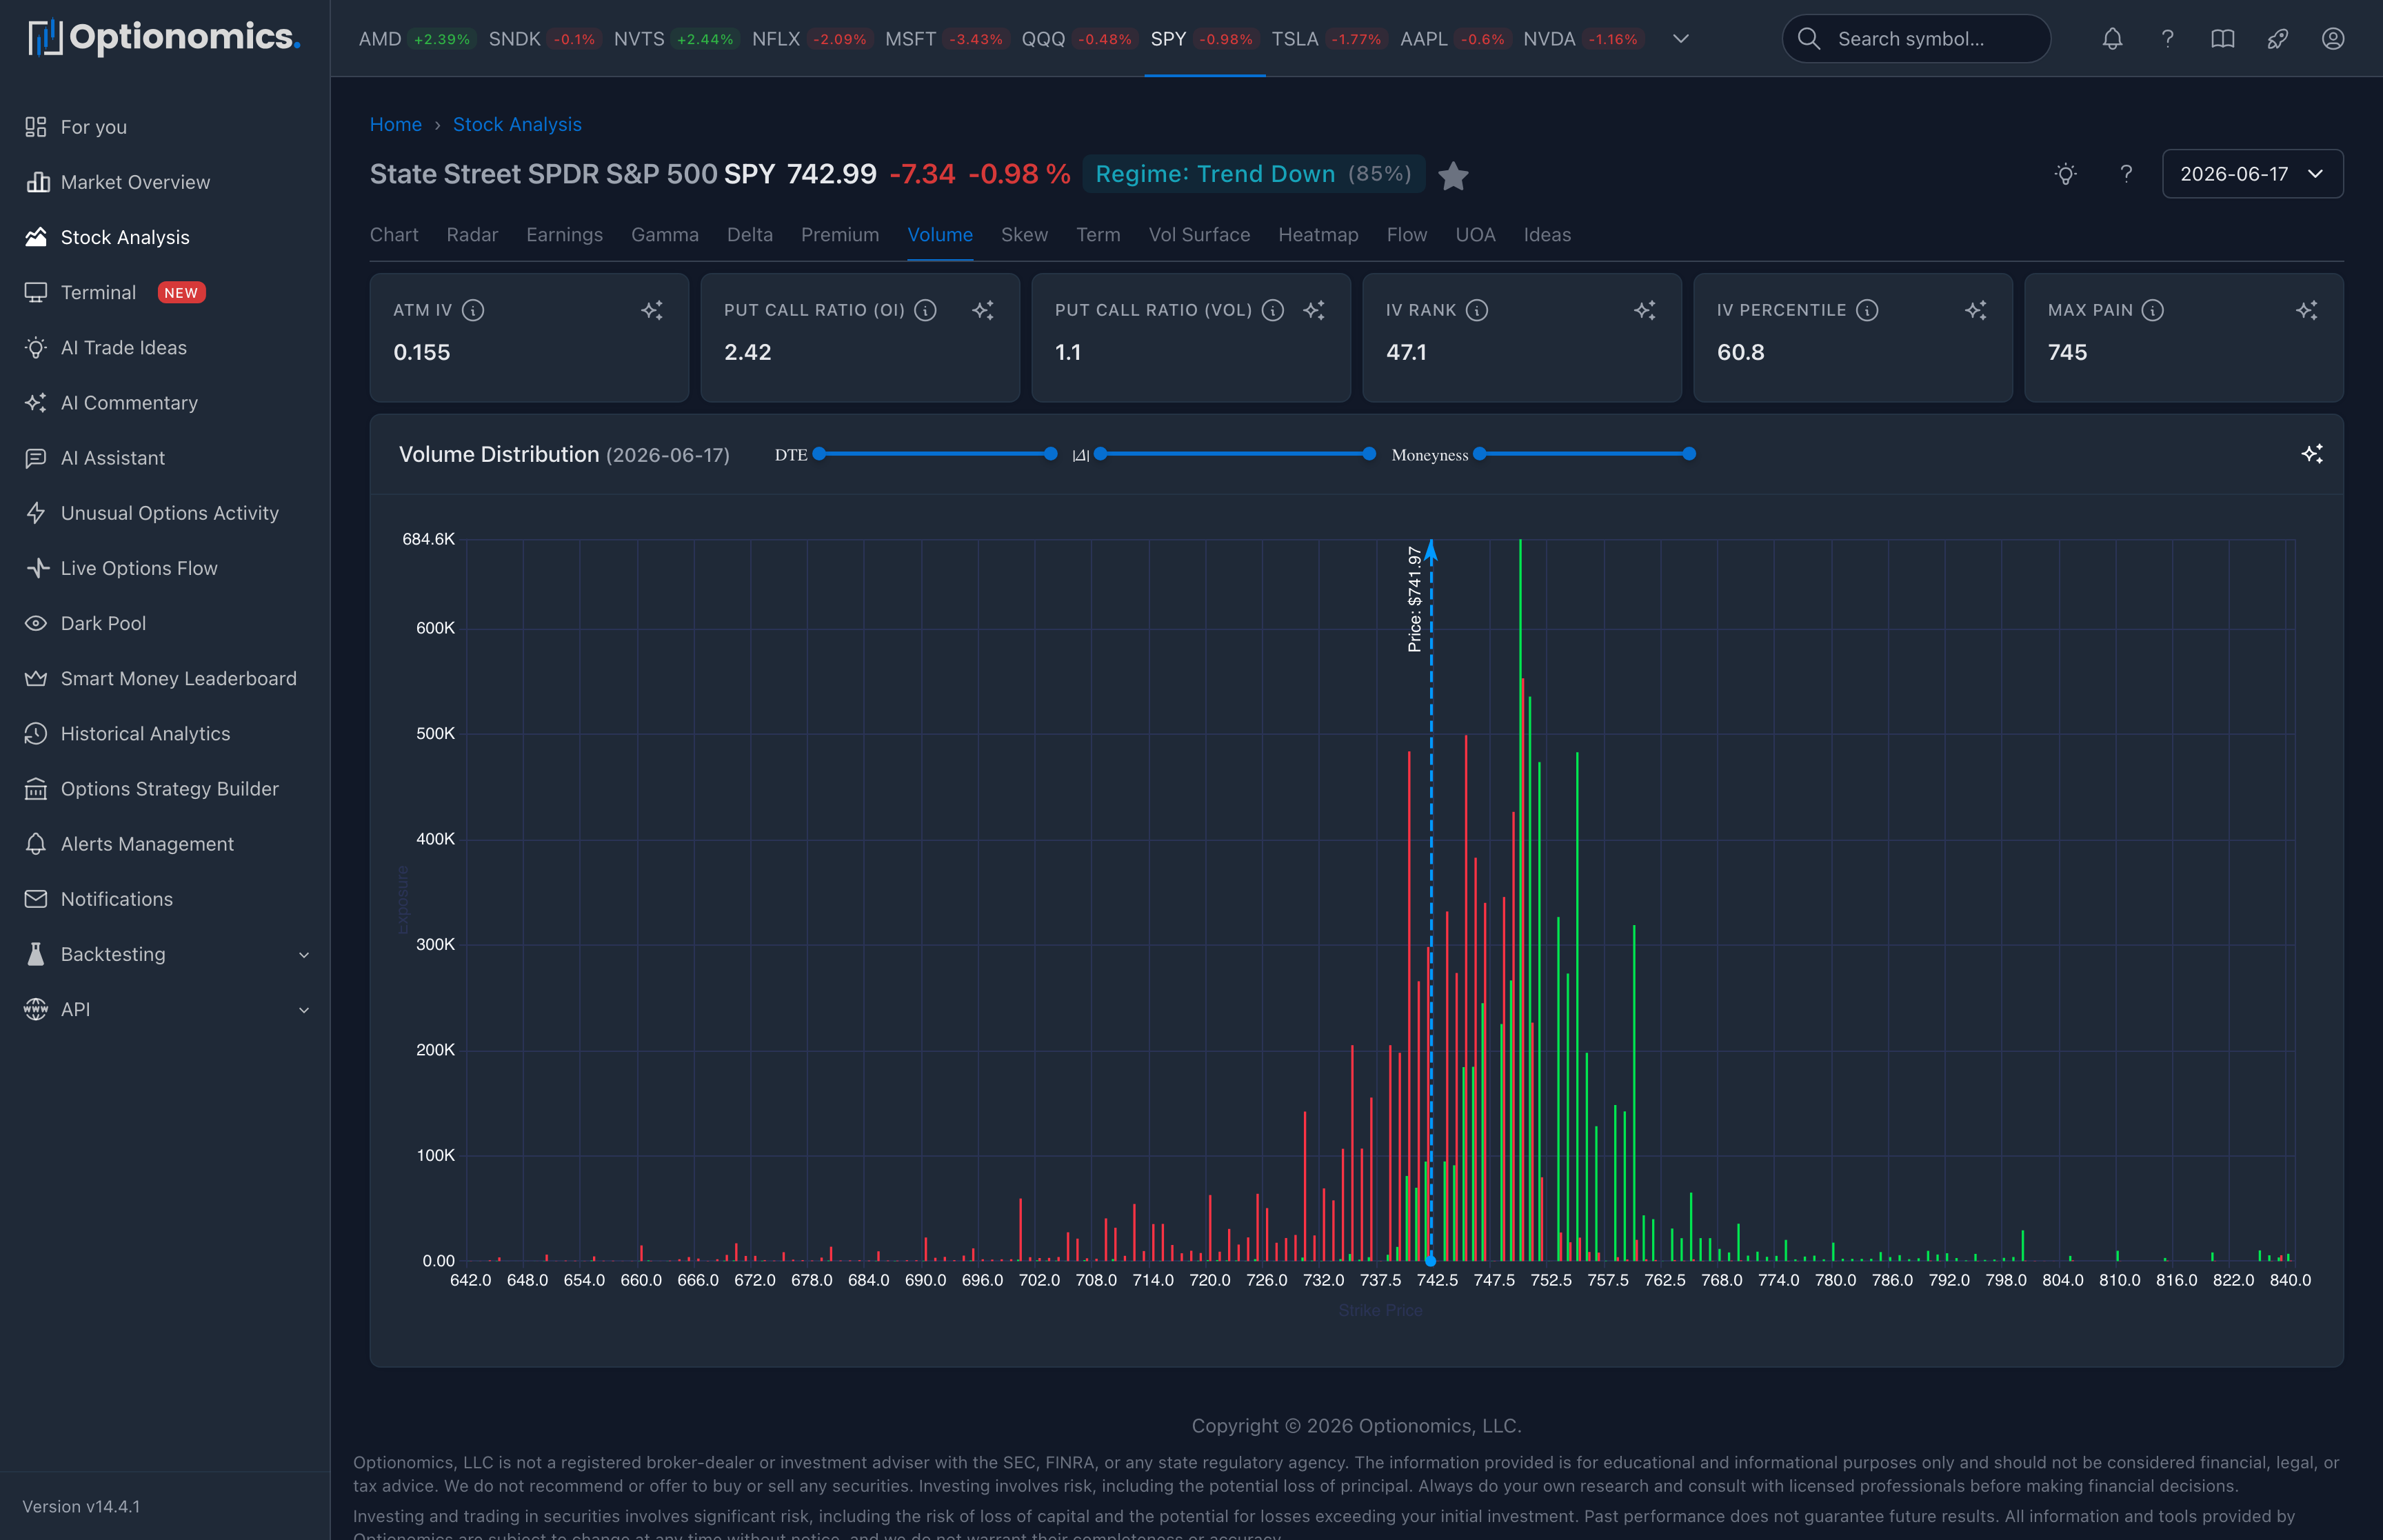
What Volume Distribution shows
Volume Distribution groups the selected session’s option contract volume by strike. It helps you find active strikes and compare call- and put-side trading activity.
Availability: Delta plan and higher.
Open it: Search for a symbol, open the Stock Workspace, and choose Volume.
Read the chart
| Chart feature | What it means |
|---|---|
| Tall bar | More contracts traded at that strike |
| Call side | Displayed call volume |
| Put side | Displayed put volume |
| Concentration | Activity is focused at fewer strikes |
| Current-price marker | The stock’s location relative to active strikes |
Volume measures activity, not intent. The chart alone cannot determine whether contracts were bought or sold, opened or closed, or paired with stock or another option leg.
Volume relative to open interest
The volume/open-interest ratio compares current-session contract volume with previously reported open interest. A larger ratio means today’s activity is large relative to that prior position base.
It does not prove that all current volume is new positioning. Open interest updates on a different schedule, and intraday volume can include opening and closing transactions.
Filters
Use DTE, delta, moneyness, and strike controls to focus on the part of the chain relevant to your horizon. Keep the filters visible when comparing this chart with another date or symbol.
Practical workflow
- Identify the most active call and put strikes.
- Compare volume with open interest and premium without assuming direction.
- Open Options Flow or Unusual Options Activity for execution and contract details.
- Compare with Gamma Exposure and Premium Distribution.
- Use Time Travel to see whether activity was isolated to one session or repeated.
Volume can help direct attention, but high activity does not guarantee a price move or an informed trade.
