Delta Exposure
Modeled directional exposure across the option chain
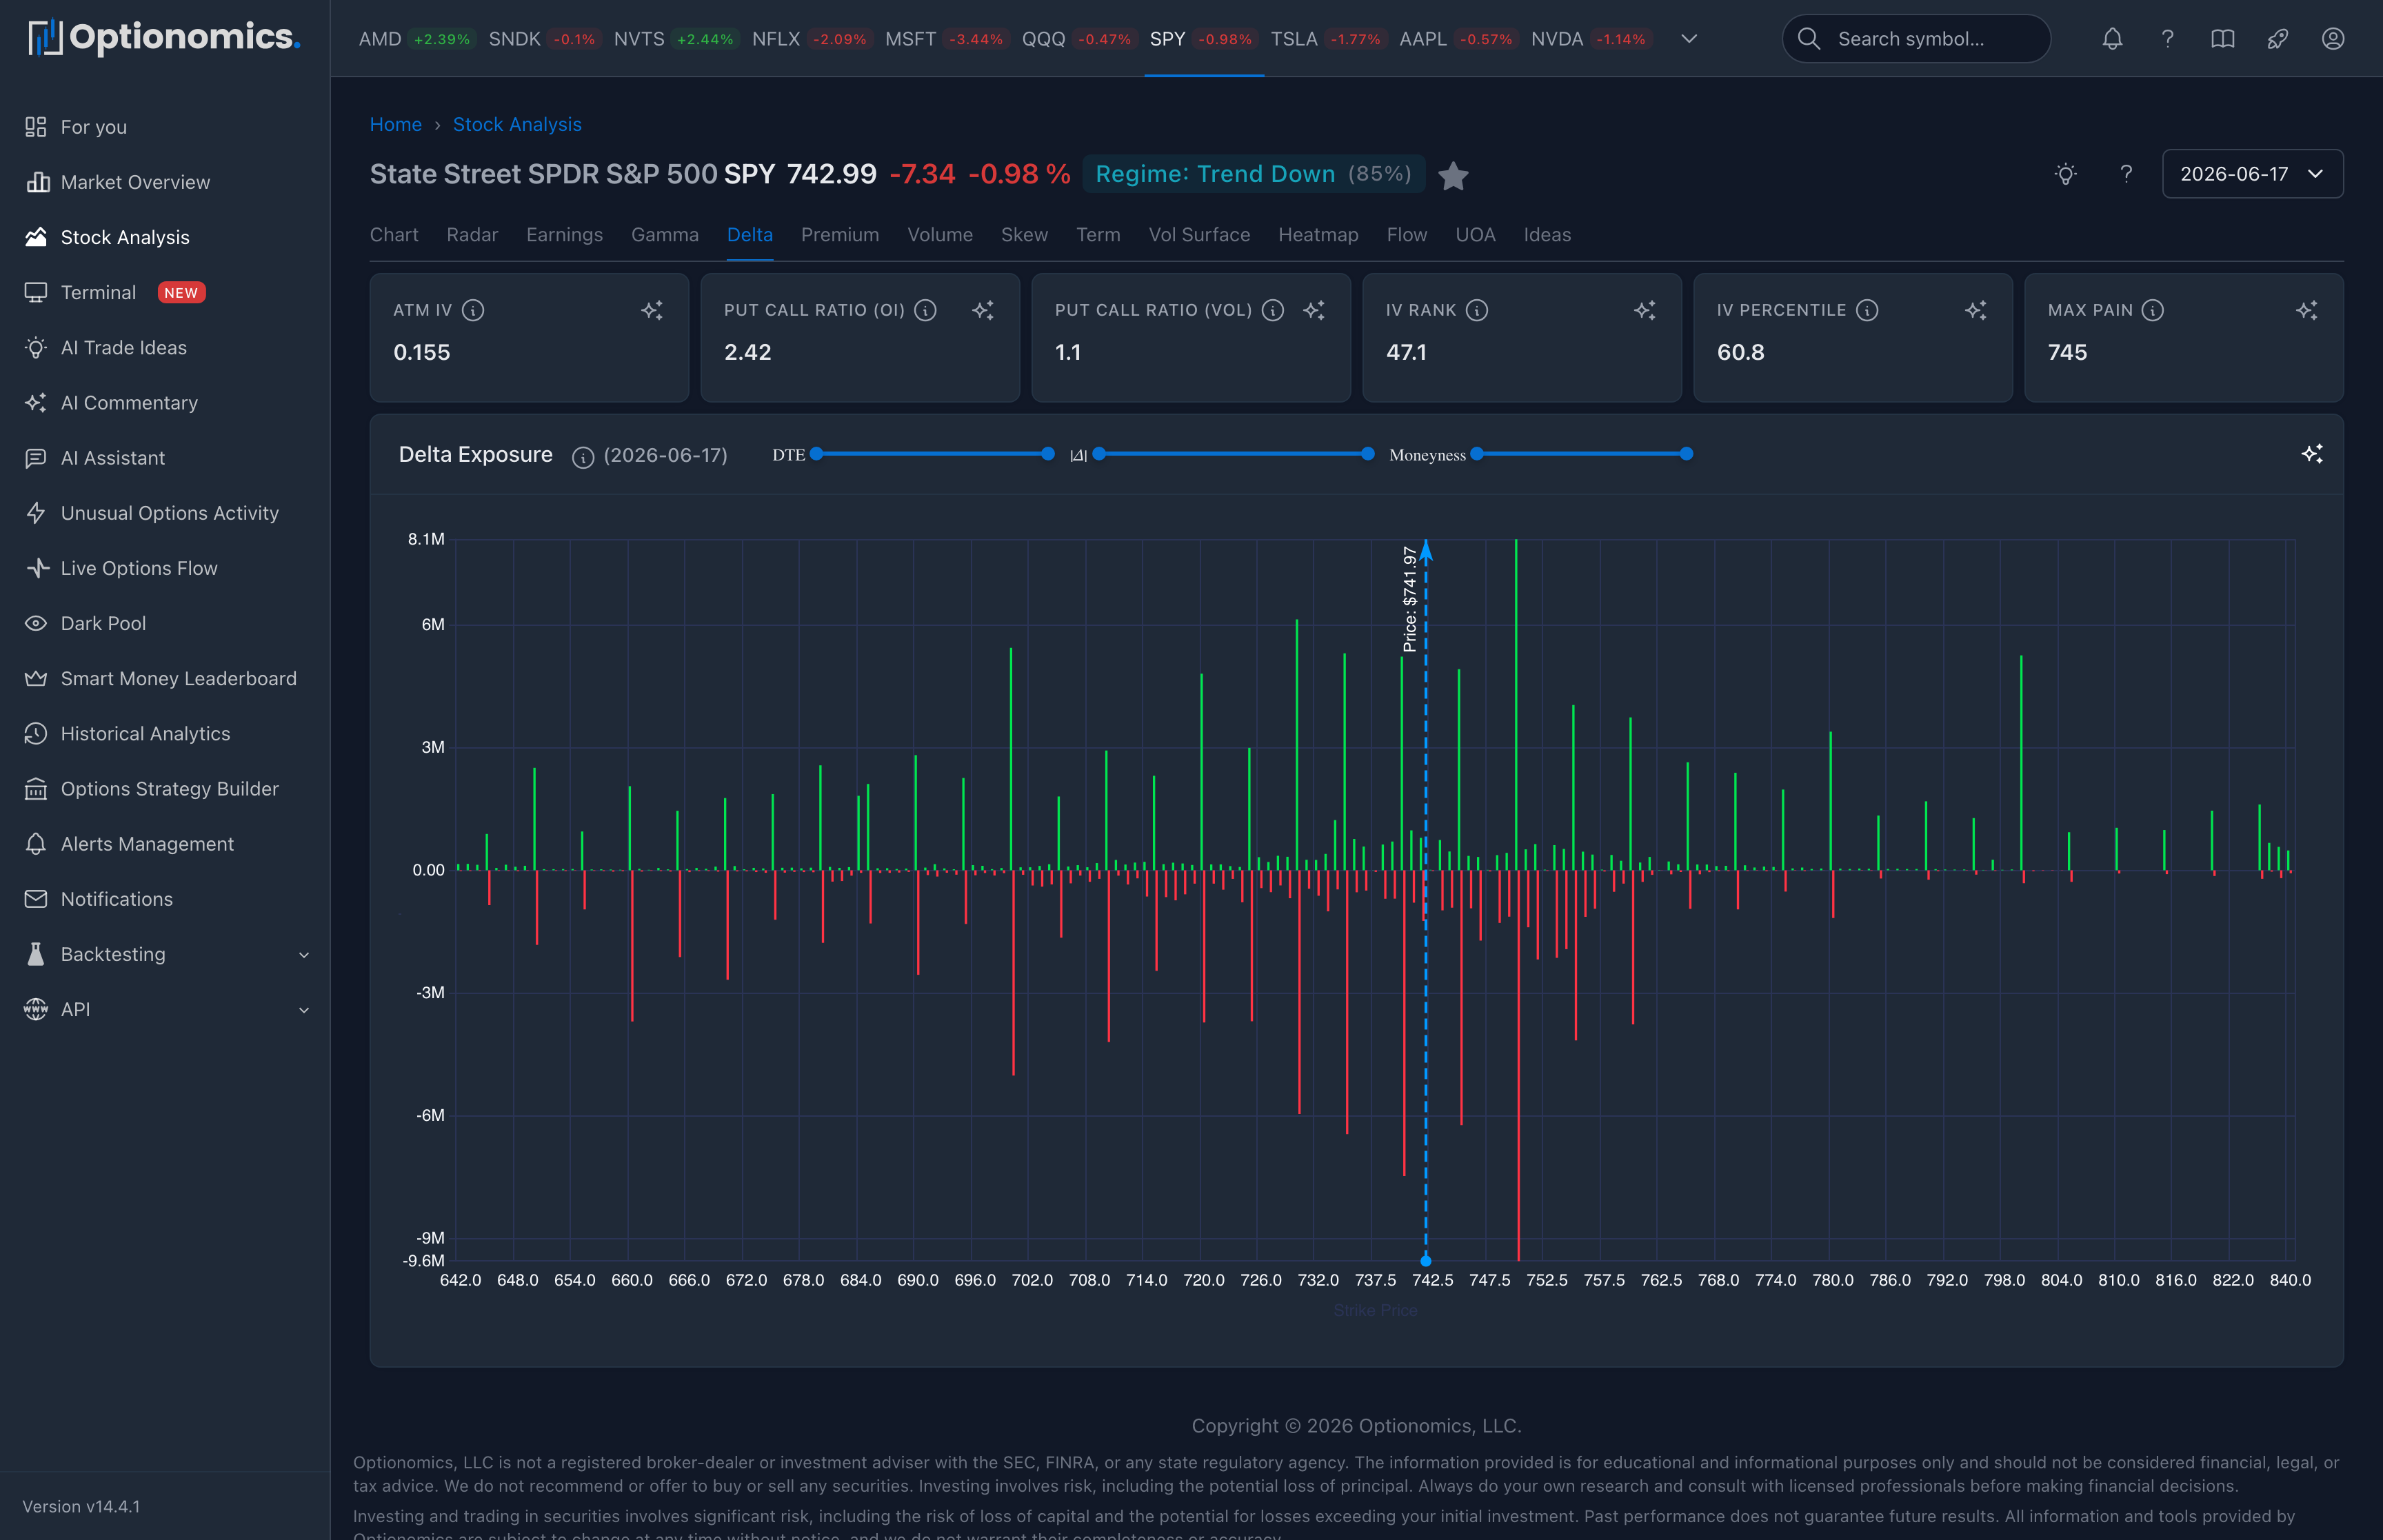
What the Delta tab shows
Delta Exposure aggregates modeled option delta across strikes for the selected symbol, date, and filters. It helps you compare call- and put-side directional sensitivity in the displayed chain.
Availability: Delta plan and higher.
Open it: Search for a symbol, open the Stock Workspace, and choose Delta.
Delta in brief
Delta estimates how much an option’s value changes for a small move in the underlying, all else equal. Calls normally have positive delta and puts normally have negative delta. The magnitude changes with price, volatility, and time.
Aggregating contract delta produces a chain-level estimate. It does not reveal the complete portfolio, intent, or hedge of the participants behind those contracts.
Read the chart
| Chart feature | What it means |
|---|---|
| Positive bar | Positive modeled delta contribution at that strike |
| Negative bar | Negative modeled delta contribution at that strike |
| Large magnitude | More aggregate directional sensitivity in the displayed contracts |
| Concentration | A smaller number of strikes contains a larger share of the estimate |
| Current-price marker | The stock’s location relative to those strikes |
Do not convert a positive bar directly into “bullish buying” or a negative bar into “bearish buying.” Open interest can include buyers and sellers, multi-leg strategies, and hedges.
Filters
Use the DTE, delta, moneyness, and strike controls to focus on near-term or longer-dated contracts and on the strike range relevant to your question. Keep the filters consistent when comparing Delta with Gamma, Premium, or Volume.
Combine with other views
- Gamma Exposure adds context about how directional sensitivity can change as the stock moves.
- Volume Distribution shows where contracts traded in the selected session.
- Premium Distribution shows where the displayed dollar value is concentrated.
- Volatility Skew shows how implied volatility differs across strikes.
- Options Flow provides the individual recent prints and execution context.
Practical workflow
- Identify the aggregate sign and the largest strike concentrations.
- Narrow to the expiration window relevant to your horizon.
- Compare Delta and Gamma using the same filters.
- Check whether recent Flow and Volume support the same interpretation.
- Use Time Travel to see how the exposure changed across sessions.
Delta exposure is a changing snapshot. Price movement, time decay, new trades, exercises, and expiration can alter it quickly.
