Premium Distribution
Displayed option value by strike
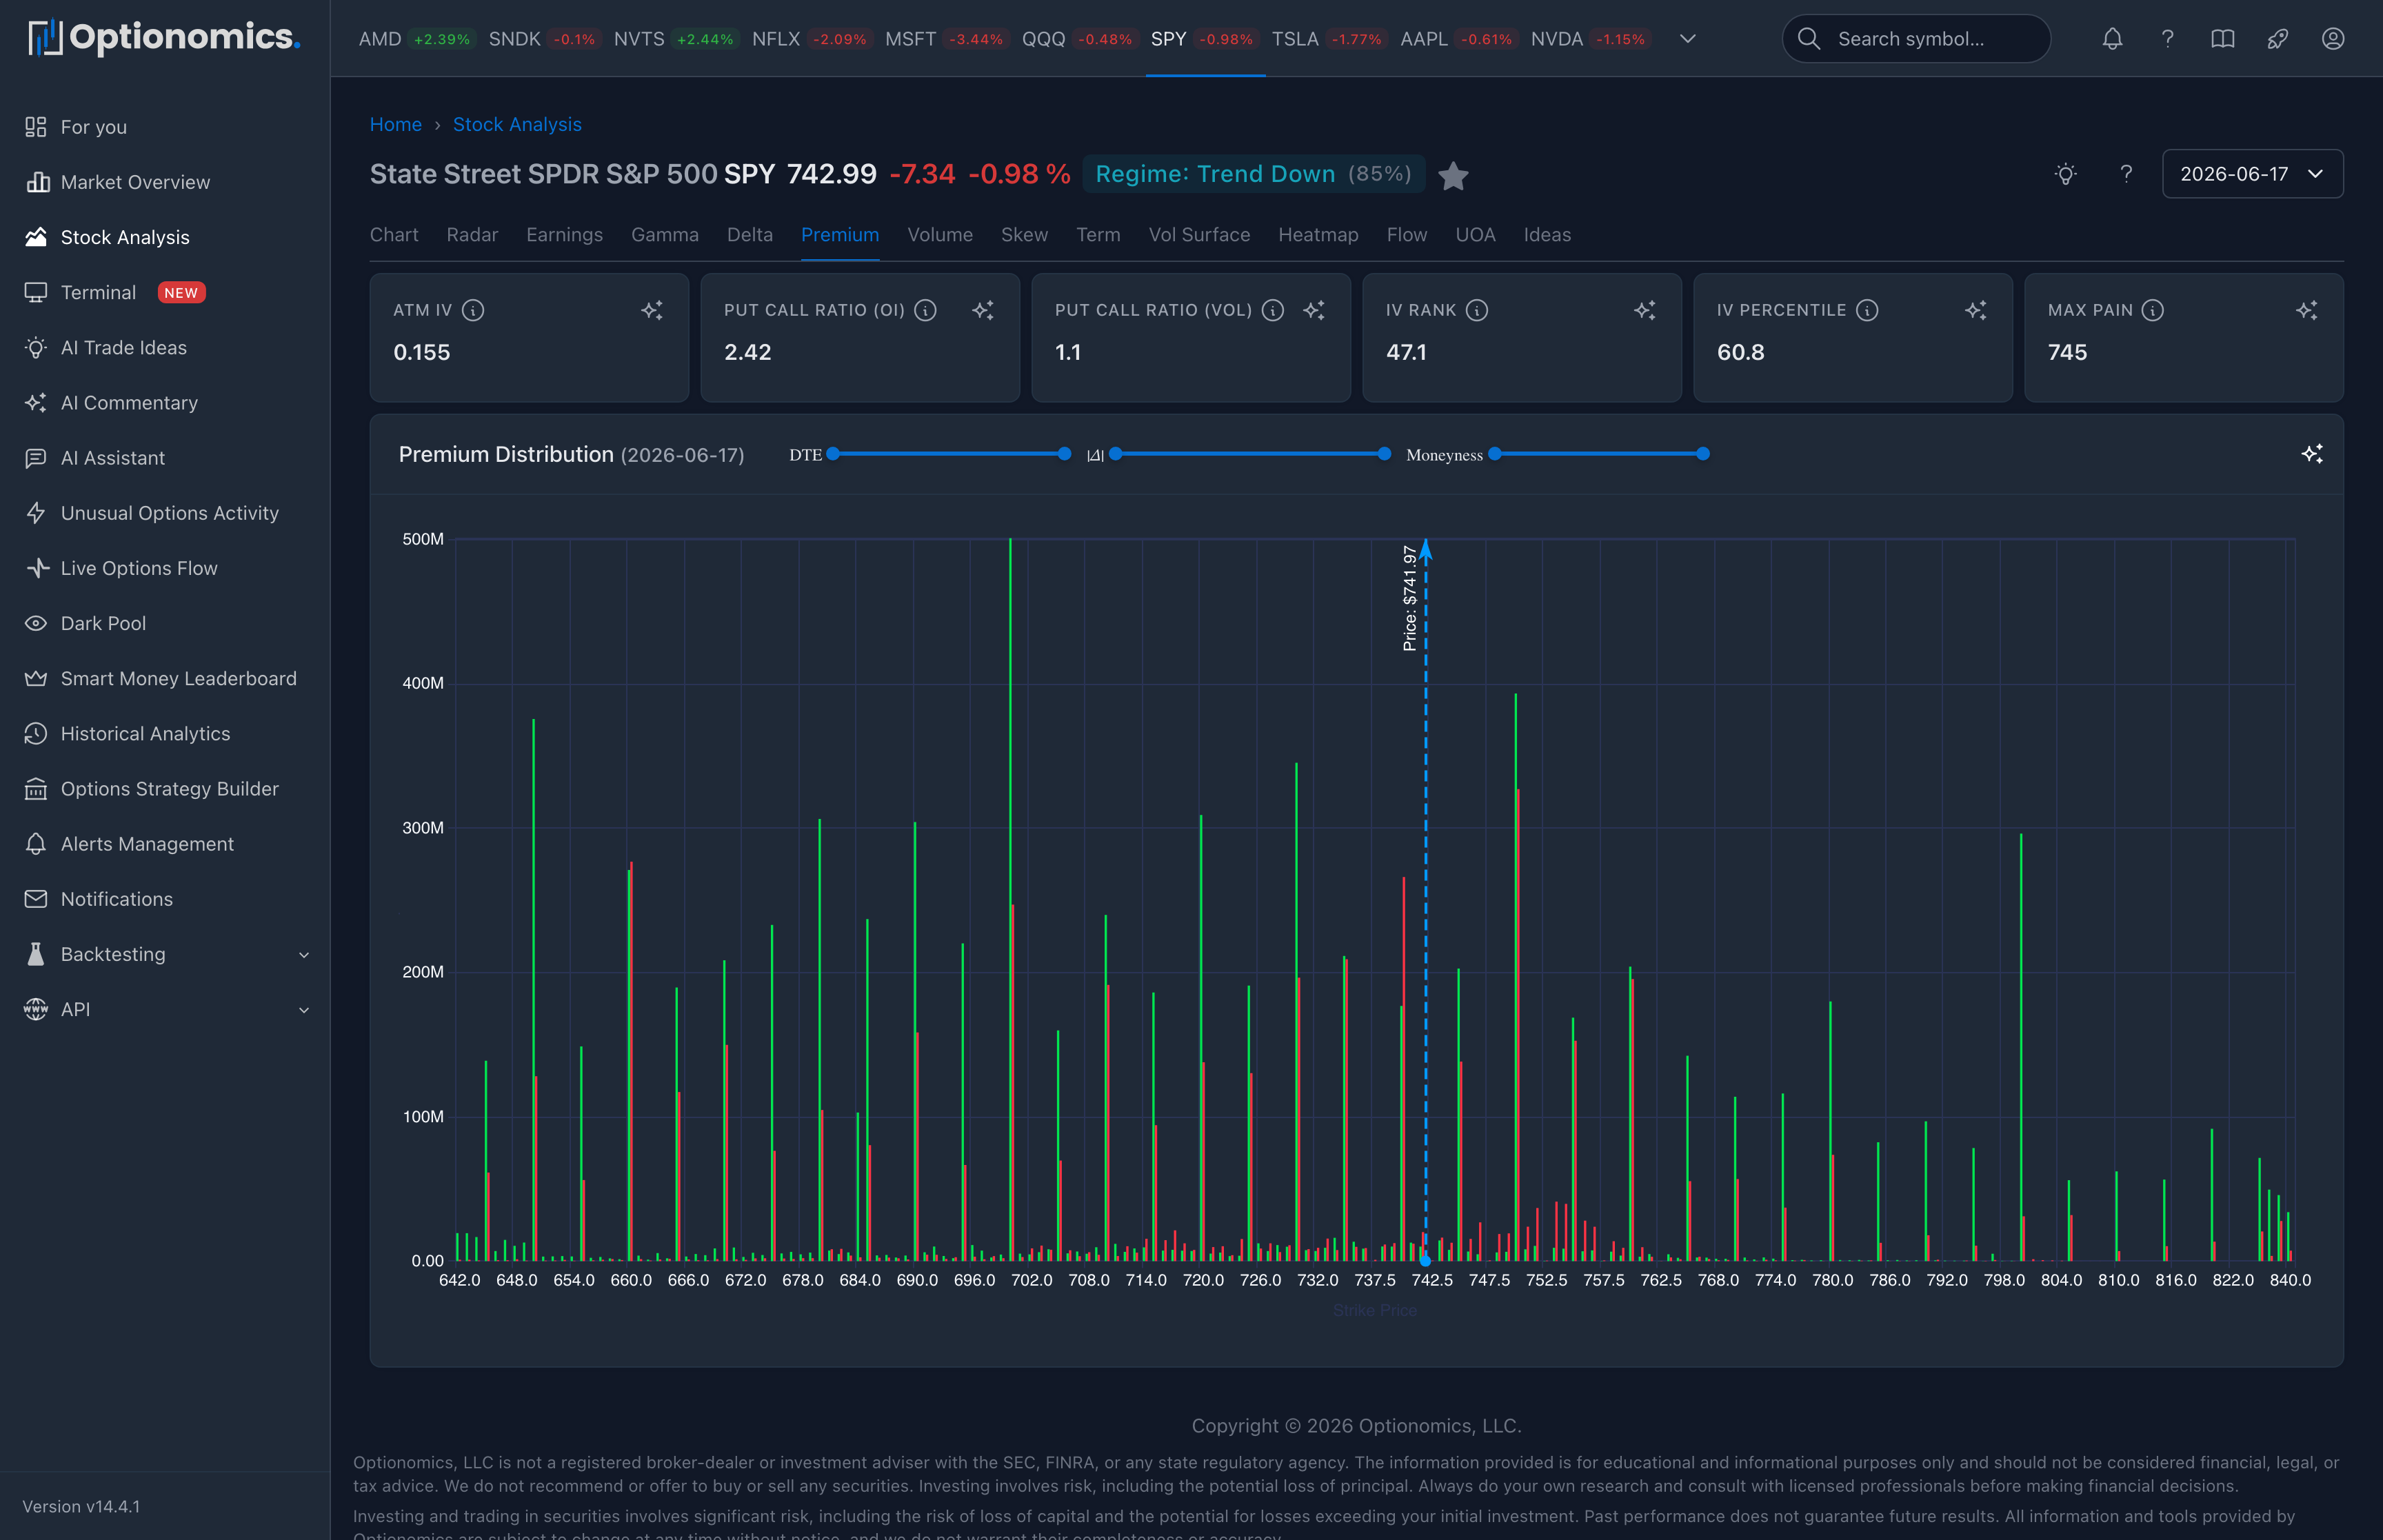
What Premium Distribution shows
Premium Distribution groups the displayed option value by strike for the selected chain snapshot. It helps you locate strikes where call- or put-side value is concentrated.
Availability: Delta plan and higher.
Open it: Search for a symbol, open the Stock Workspace, and choose Premium.
Read the chart
| Chart feature | What it means |
|---|---|
| Tall bar | More displayed option value at that strike |
| Call side | Value associated with calls in the selected contracts |
| Put side | Value associated with puts in the selected contracts |
| Asymmetry | One side represents more displayed value than the other |
| Current-price marker | The stock’s location relative to the concentrations |
Premium concentration does not identify the owner or intent of a position. A large value can reflect opening or closing trades, multi-leg structures, hedges, or older open interest.
Filters
Use DTE, delta, moneyness, and strike filters to isolate the contracts relevant to your horizon. A short-dated view and an all-expiration view can tell very different stories, so include the filter context when recording a level.
Practical workflow
- Find the largest call- and put-side concentrations.
- Compare their distance from the current stock price.
- Use Volume Distribution to see whether those strikes are active in the selected session.
- Use Gamma Exposure and Delta Exposure to compare modeled sensitivities.
- Open Options Flow for recent execution context.
- Use Time Travel to see whether the concentration persisted across snapshots.
A high-premium strike is not guaranteed support, resistance, a target, or a sign of conviction. Use it to decide where to investigate further.
