Dark Pool Trades
Off-exchange equity prints distilled into a daily dashboard
Why dark pool data belongs in an options platform
Options traders care about where stock liquidity has concentrated. A meaningful share of US equity volume prints in off-exchange venues, where large transactions can appear differently from the displayed exchange book. Optionomics surfaces that activity so you can compare equity-print context with gamma, chain concentrations, and options flow.
Dark pool trades are typically large equity blocks executed with minimal pre-trade visibility, often by institutions managing impact and information leakage. They are not a holy grail: a print can be accumulation, distribution, internal crossing, or one leg of a broader program. Treat them as additional context, especially when they cluster at a price zone or align with options-derived support or resistance.
Availability: Gamma plan and higher
Pairs well with: Terminal Dark Pool S/R overlays and gamma exposure for confluence checks.
Open it: Sidebar → Dark Pool (also at /darkpool).
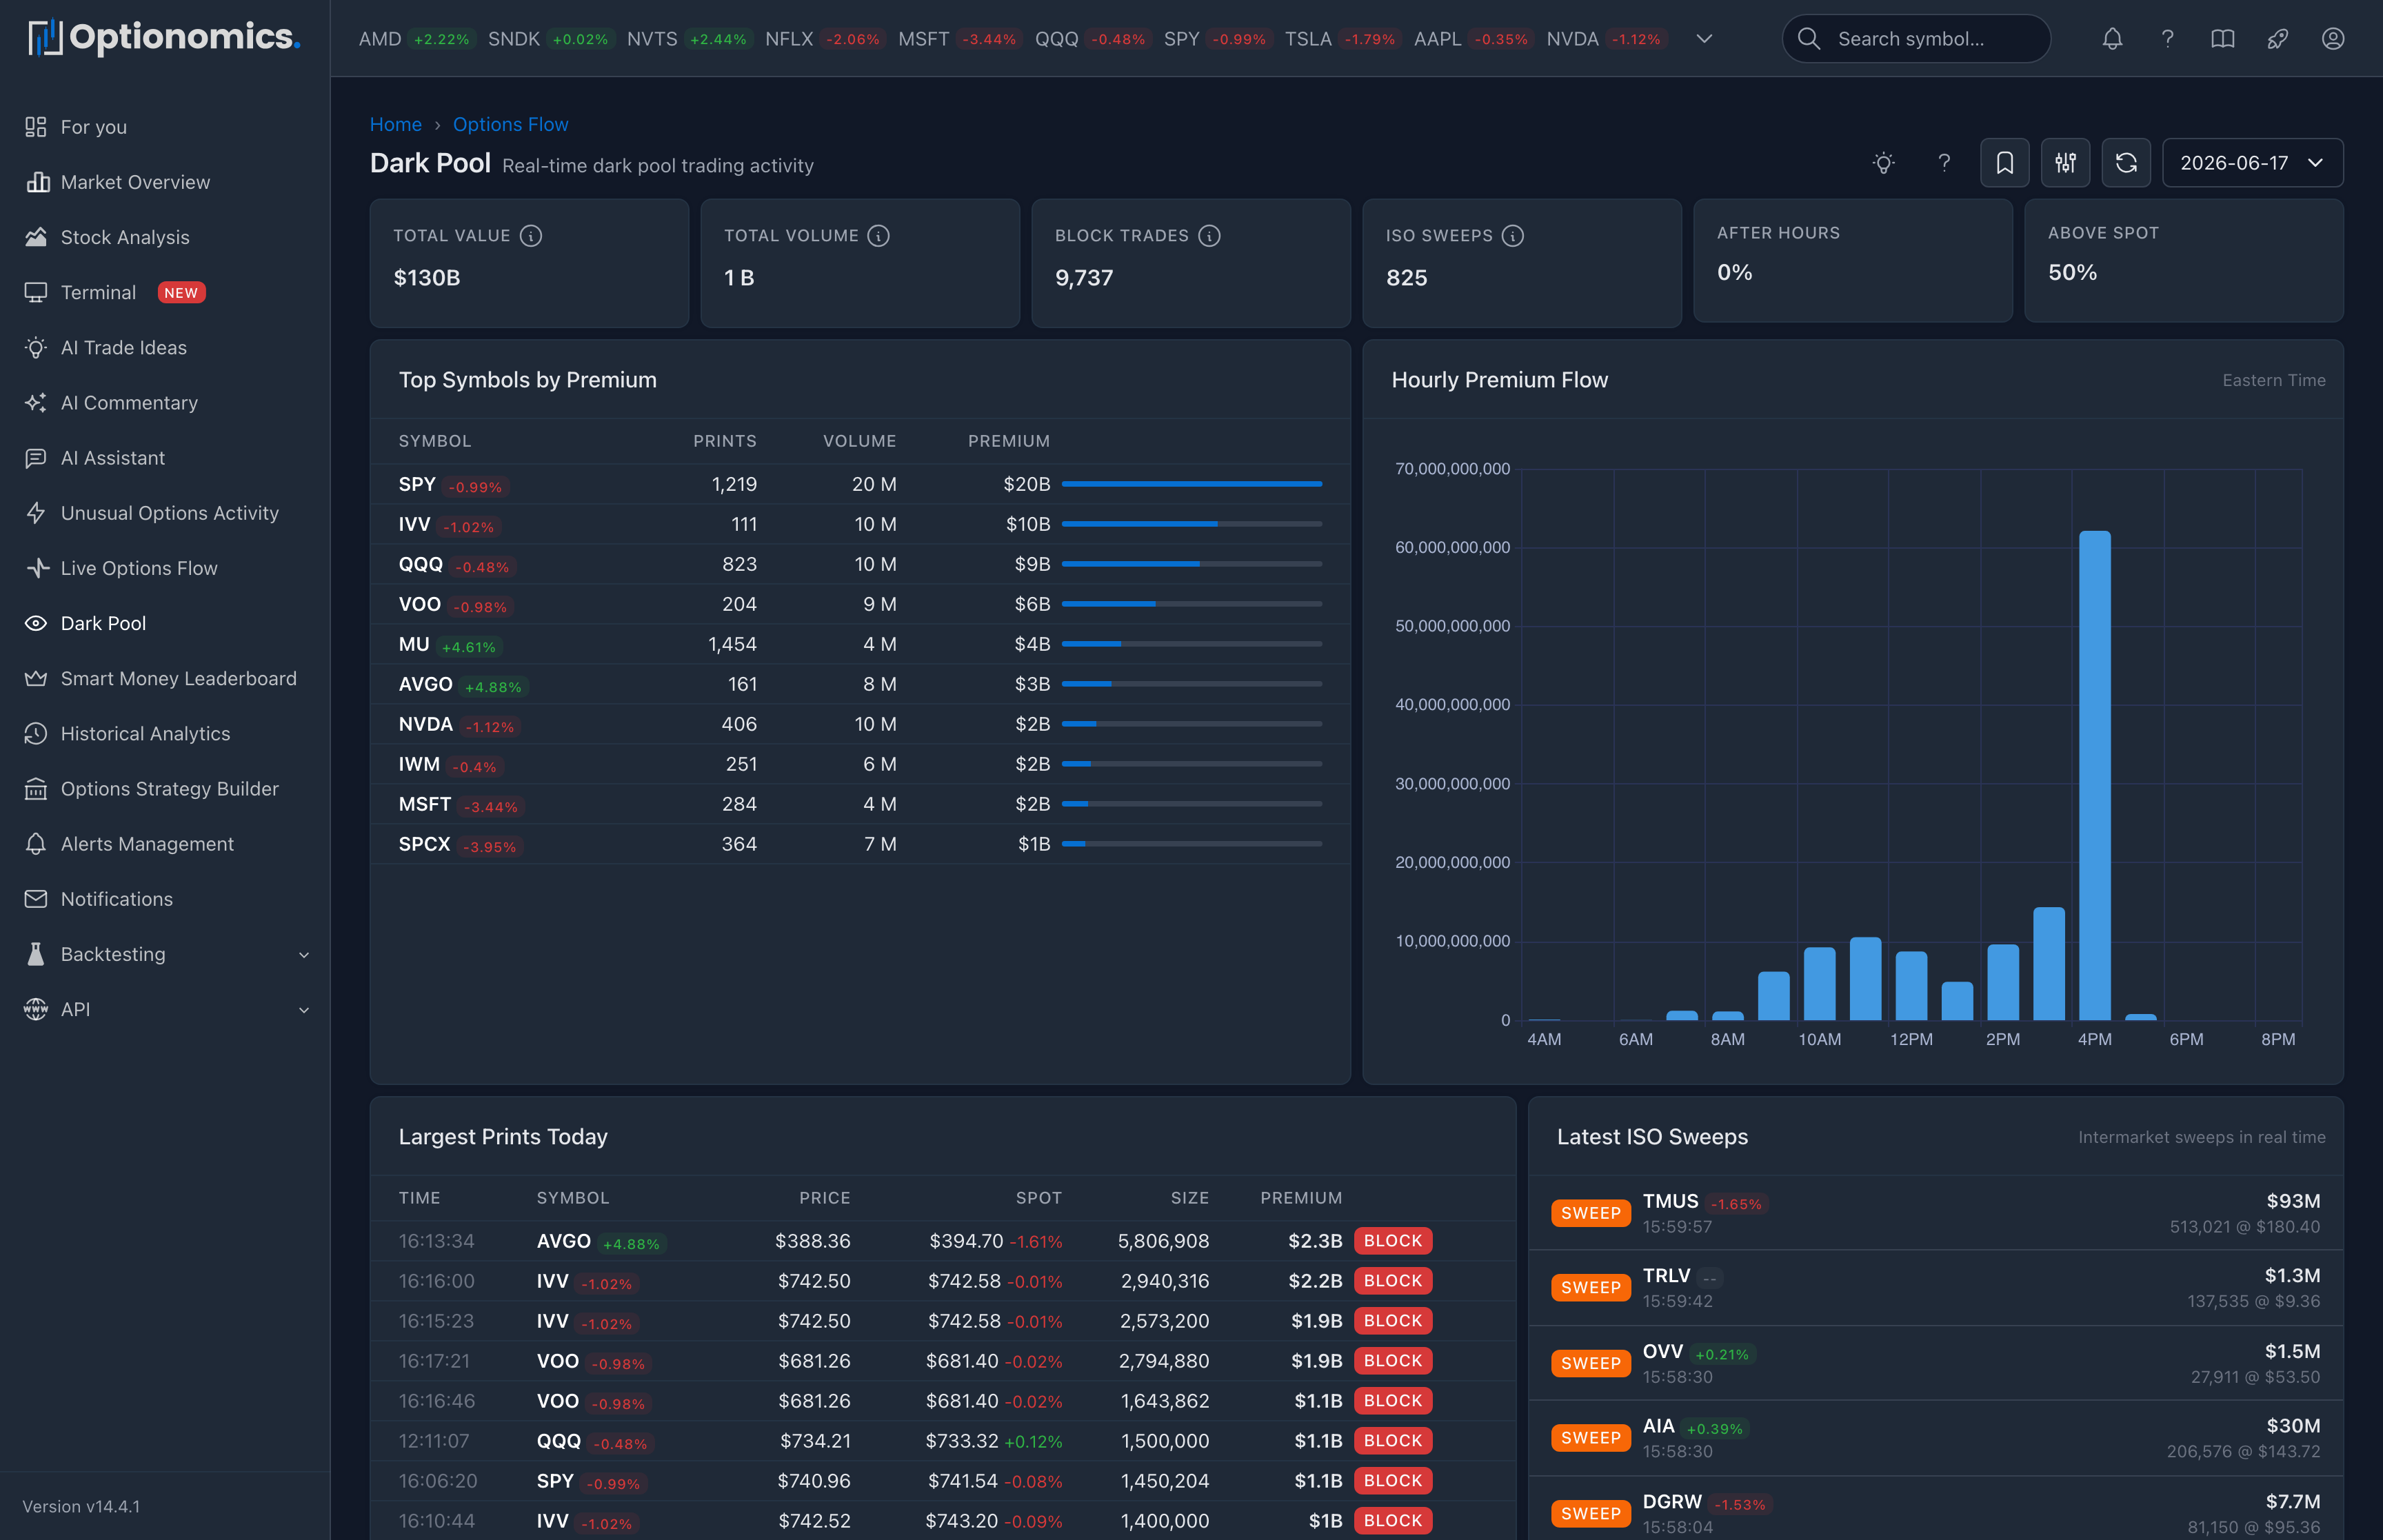
Dashboard view (no symbol selected)
When you open the page without a specific symbol, you get a widget dashboard for the entire day:
Top stat tiles
| Tile | What it shows |
|---|---|
| Total Value | Aggregate dollar volume across all dark pool prints |
| Total Volume | Aggregate share volume |
| Block Trades | Count of trades flagged as blocks |
| ISO Sweeps | Count of intermarket sweep orders |
| After Hours | Share of prints that occurred outside regular session |
| Above Spot | Share of prints that occurred above the underlying’s spot price |
Widgets
| Widget | What it shows |
|---|---|
| Top Symbols | Symbols with the highest dark pool dollar value today |
| Hourly Premium Flow | How dark pool dollars distribute across the trading day, hour by hour |
| Largest Prints Today | The biggest individual prints across the market |
| Recent Sweeps | The latest sweep prints rolling in |
| Spot Sentiment | Share of prints above vs below underlying spot, as a sentiment read |
The dashboard updates throughout the trading day as new prints arrive and helps you spot where displayed off-exchange value is concentrating without opening every name.
Symbol-focused view
Click any symbol from a widget (or use the filter to focus on one) and the page rebuilds around that ticker:
- The header switches to “{symbol} dark pool dashboard.”
- A single-symbol breakdown replaces the market-wide widgets, showing that symbol’s prints, hourly distribution, and spot-relative behavior.
- Use All Symbols in the header to drop back to the full dashboard.
Use this view when a name shows up in your watchlist or in flow you’re already tracking, and you want to see the equity-side behavior alongside the options story.
Filtering and Time Travel
The header gives you:
- Filter — narrow by size, value, trade type, or other dark pool attributes.
- Date — Time Travel to any prior trading day.
- Refresh — manual refresh on top of automatic updates.
When you move between the market-wide and symbol-focused views, review the active filter chips and selected date. A symbol link does not necessarily carry every market-wide filter into the next view.
How to read dark pool prints
Trade type tags
| Tag | Meaning | Significance |
|---|---|---|
| BLOCK | Block trade (negotiated) | Large negotiated print |
| ISO | Intermarket sweep order | Urgent, time-sensitive execution |
| AFTER HRS | Extended-hours print | Outside regular session |
| ODD LOT | Non-standard lot size | Unusual execution detail |
Patterns to look for
| Pattern | What it may mean |
|---|---|
| Repeated prints clustered at the same price | Possible accumulation / distribution zone |
| Large prints near highs with weakening price | Possible distribution |
| Large prints near lows with stabilizing price | Possible accumulation |
| Heavy after-hours value | Window to absorb size away from the lit tape |
| Sweeps clustering on a single name | Urgency from a single side |
| Print far from spot with very large value | Often a special situation (M&A, portfolio trade, basket leg) |
Building support / resistance from dark pool
A single print rarely defines a level. What strengthens a level:
| Factor | Weak level | Strong level |
|---|---|---|
| Trade size | Small | Very large value |
| Repetition | Single print | Multiple prints at the same price |
| Recency | Many days old | Within the last day or two |
| Deviation from spot | Far from spot | Close to spot |
The strongest dark pool levels usually co-locate with options-derived levels you already see in gamma exposure or in the chart’s DP overlay—use that confluence rather than dark pool alone.
Important context
- Dark pool prints are anonymous; the side (buy vs sell) is inferred, not certified.
- Large prints can be opening, closing, or one leg of a complex strategy—the tape rarely proves which.
- After-hours and odd-lot prints often look unusual; that does not always mean directional.
- Treat dark pool levels as additional evidence, not a primary trigger.
Remember: Dark pool data shows where off-exchange equity volume printed, not where price must go. Use it for confluence with options positioning, news, and your own plan.
Related:
- Options Flow
- Terminal — dark pool S/R overlays on the chart
- Terminal — DP toggle on the symbol chart
- Gamma Exposure