Historical Lab
Compare market signals across time in one workspace
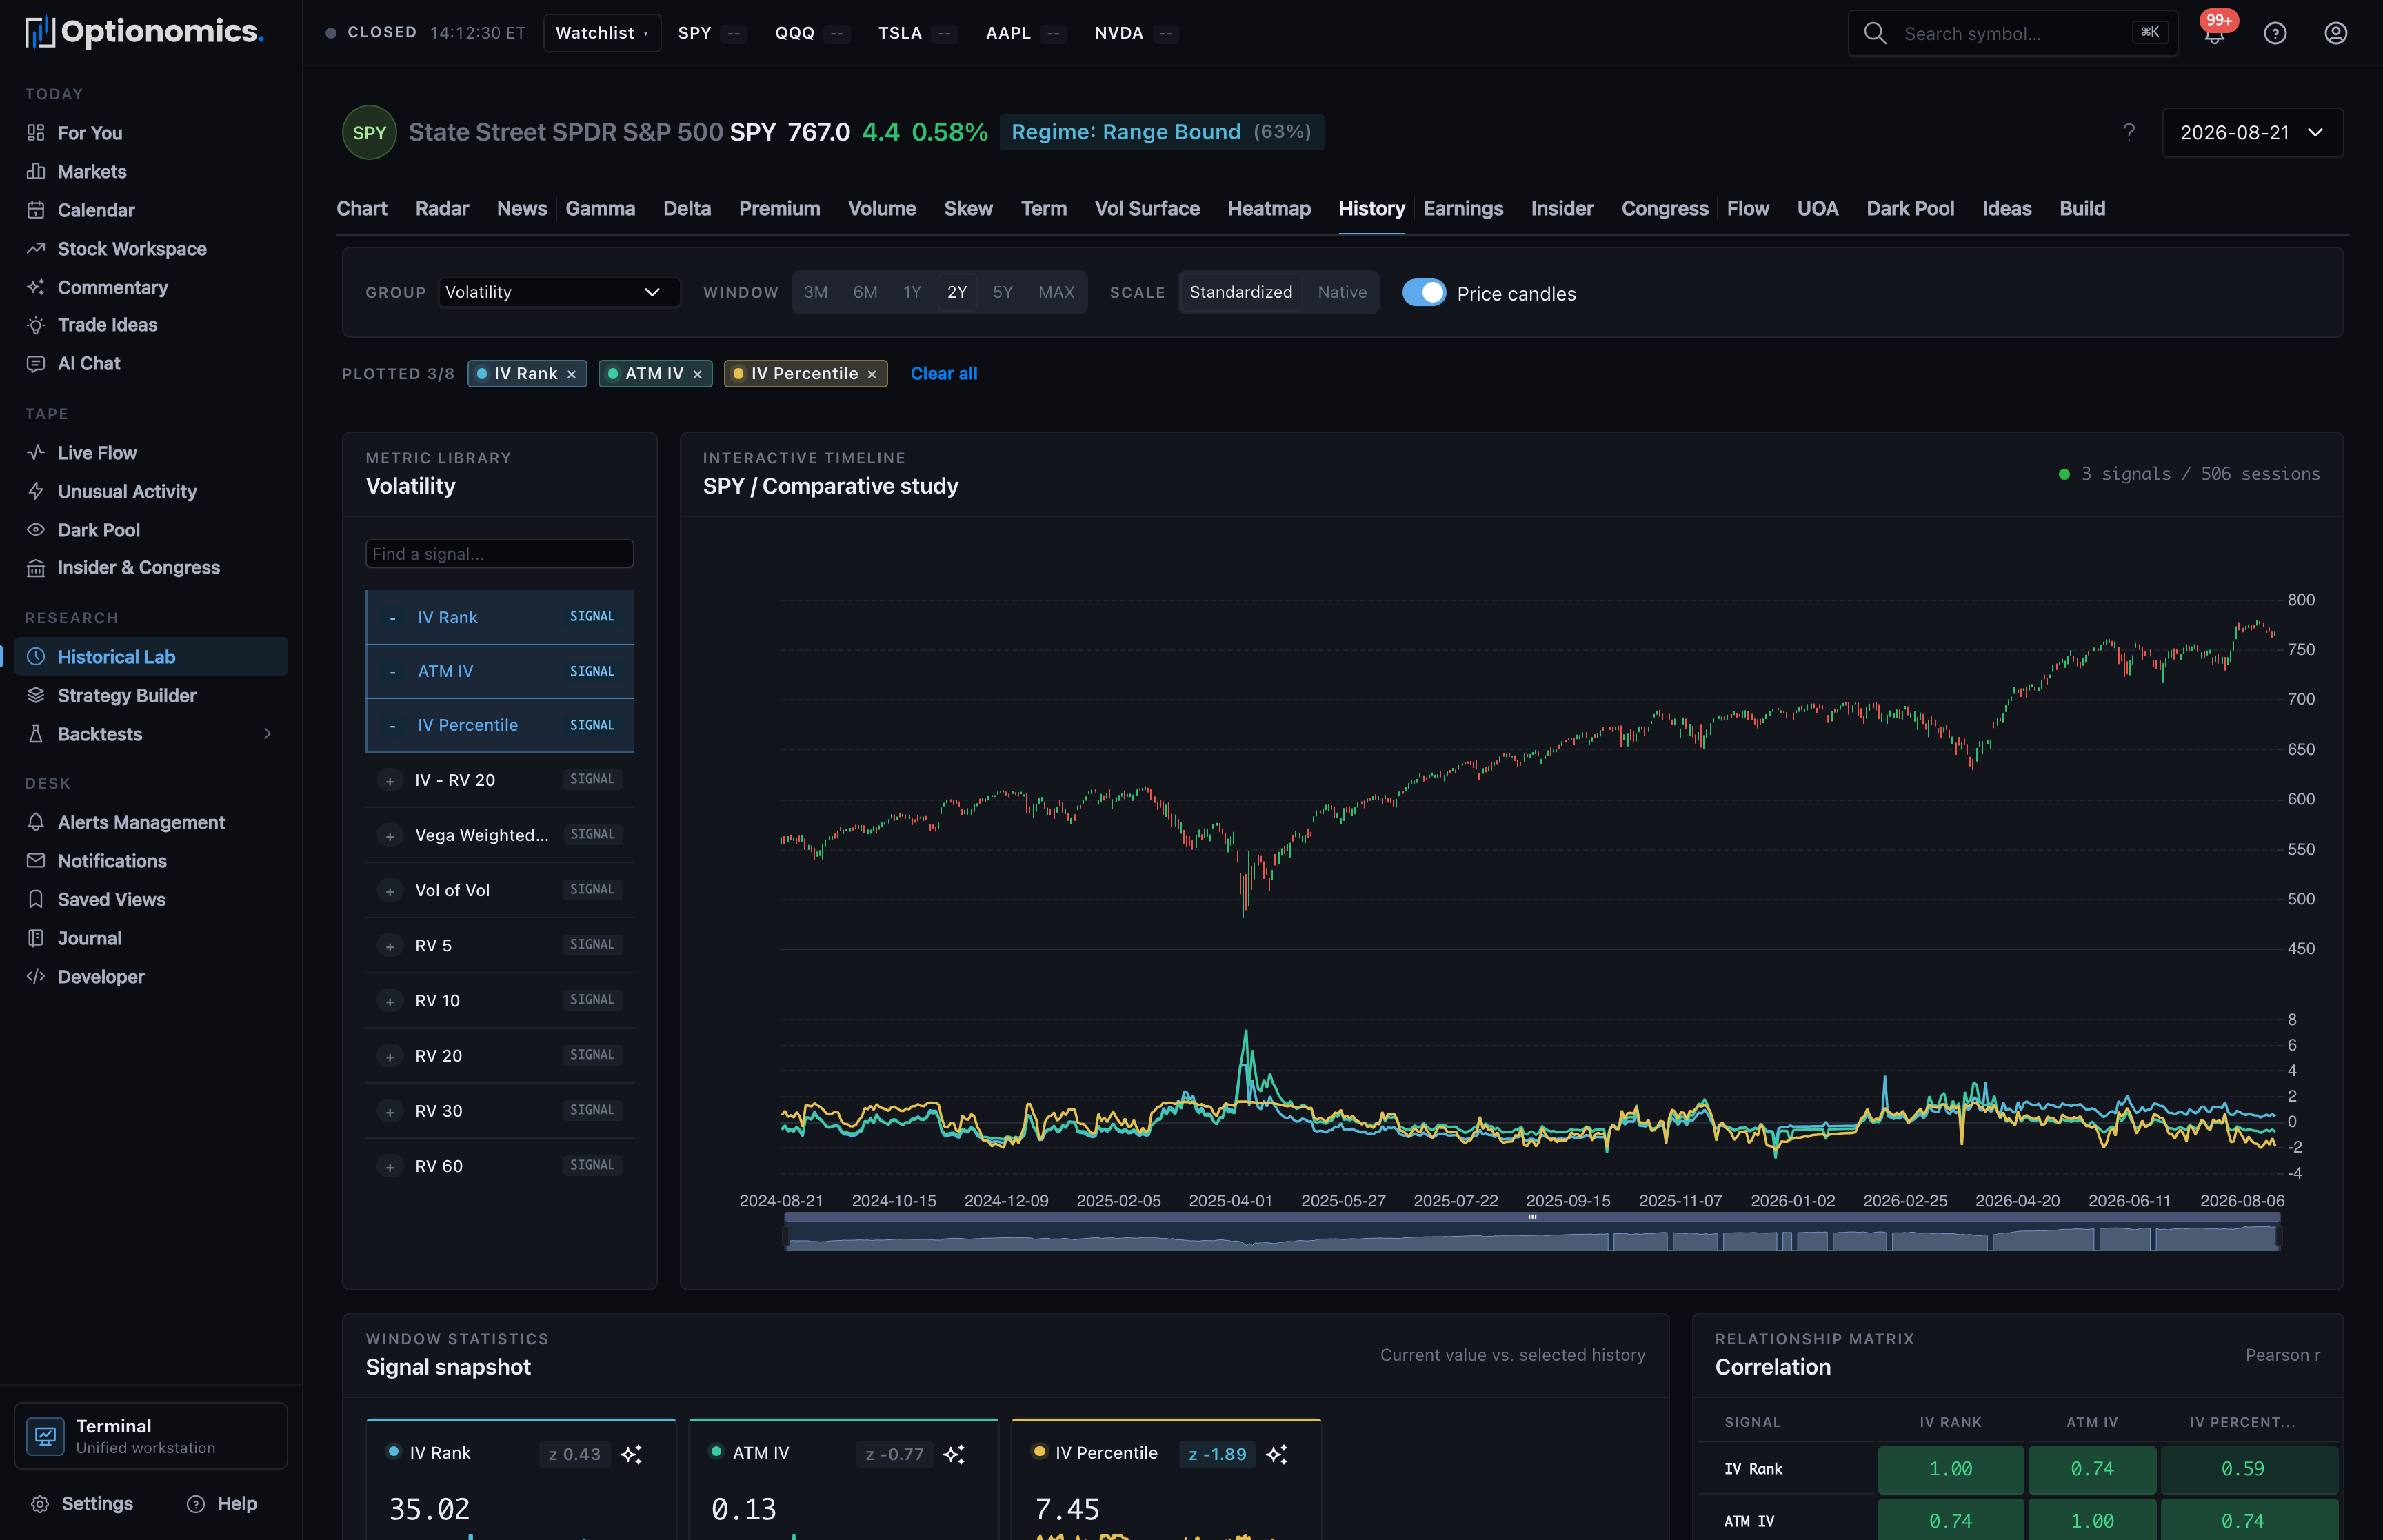
What the Historical Lab does
The Historical Lab replaces the former collection of separate historical chart pages. It gives you one comparative timeline for a symbol, with a searchable metric library, consistent date windows, statistics, correlation, and a source-observation inspector.
Use it to answer questions such as:
- Is today’s reading typical or unusual for this symbol?
- Did volatility, positioning, sentiment, and price change together during a prior event?
- Does a relationship remain visible across a short window and a longer market regime?
- Which observations produced the summary shown on the chart?
Availability: Delta plan and higher.
Open it: Choose Historical Lab in the web sidebar (under Research), open the History tab on any stock page, or go to /history/stocks/:symbol/analysis for a tracked symbol.
Choose metrics
The metric library groups the historical signals available for the selected symbol into eleven categories: Volatility, Volatility Skew, Greeks Exposure, Expected Move, Momentum, Max Pain, Sentiment, Put / Call Ratios, VIX Metrics, Net Greeks, and Trading Analytics. Use the Find a signal search box when you know the signal name—searching looks across every category at once—or choose a group to browse related measures.
Click a metric to add it to the timeline. Click its chip above the chart to remove it, or use Clear all. You can plot up to eight signals at a time; a smaller set is usually easier to read. Each metric row carries a PRICE or SIGNAL badge that tells you which axis it draws on.
Metric availability can vary by symbol and date. An empty value means the platform does not have a valid observation for that session; it should not be read as zero.
Set the comparison window
The workspace offers these windows:
| Window | Useful for |
|---|---|
| 3M | Recent events and short regime changes |
| 6M | Earnings cycles and medium-term shifts |
| 1Y | A full annual comparison |
| 2Y | Multiple volatility and market regimes |
| 5Y | Longer-cycle research |
| MAX | All available history for the selected symbol |
Changing the window recalculates the statistics shown below the chart. A standardized value in one window is therefore not directly interchangeable with the same value from another window.
Standardized and native scales
- Standardized expresses each selected signal relative to its own average and variability in the chosen window. This makes differently sized measures easier to compare on one chart.
- Native plots values in their original units on the shared signal axis. Use it when the actual magnitude matters more than shape comparison.
- Price candles add the underlying stock’s daily price history so you can compare signals with price action.
Standardization is a viewing aid. It does not convert correlation into causation and does not make signals with different definitions economically equivalent.
Read the workspace
Interactive timeline
The main chart plots the selected signals and, when enabled, price candles. Hover or zoom to inspect a period more closely. Use Reset chart view after zooming, and use fullscreen when several series need more space.
Signal snapshot (window statistics)
Each selected signal gets a snapshot card with its current value, a compact sparkline, the window mean, the change across the window, and a z badge showing the standardized distance from the window mean. Where your plan includes AI Insights, each card also carries a sparkle button for a plain-language readout. These numbers describe the selected history; they are not entry or exit rules.
Correlation matrix
When at least two signals are selected, the matrix shows their Pearson correlation over the observations available in the current window. Values near +1 moved together, values near -1 moved in opposite directions, and values near 0 had little linear relationship.
Correlation can change across windows and can be distorted by a shared market event. Use it to form a question, then inspect the timeline and source rows.
Data inspector
The data inspector lists the dated source observations behind the visible study—date, close, and one column per selected metric, newest first. Change the page size (25, 50, or 100 rows) and page through the history to verify exactly which observations produced the summary above.
A practical workflow
- Search for the symbol and open the Historical Lab.
- Choose one question, such as whether implied volatility and realized movement diverged around prior earnings.
- Add two or three relevant signals rather than filling all eight slots immediately.
- Start with a one-year or two-year window, then compare it with a shorter window.
- Enable price candles and inspect the dates where the relationship changed.
- Check the statistics, correlation matrix, and source observations before drawing a conclusion.
Historical Lab versus backtesting
The Historical Lab is an exploratory research workspace. It helps you compare observations but does not simulate orders or produce a strategy return.
Use Backtesting when you want to define a historical test and review modeled outcomes. Backtest results remain hypothetical and depend on their assumptions.
Remember: Historical relationships can weaken or disappear. Treat the Lab as context for research, not a prediction of the next move.
