Market Radar
A structural options snapshot for one symbol
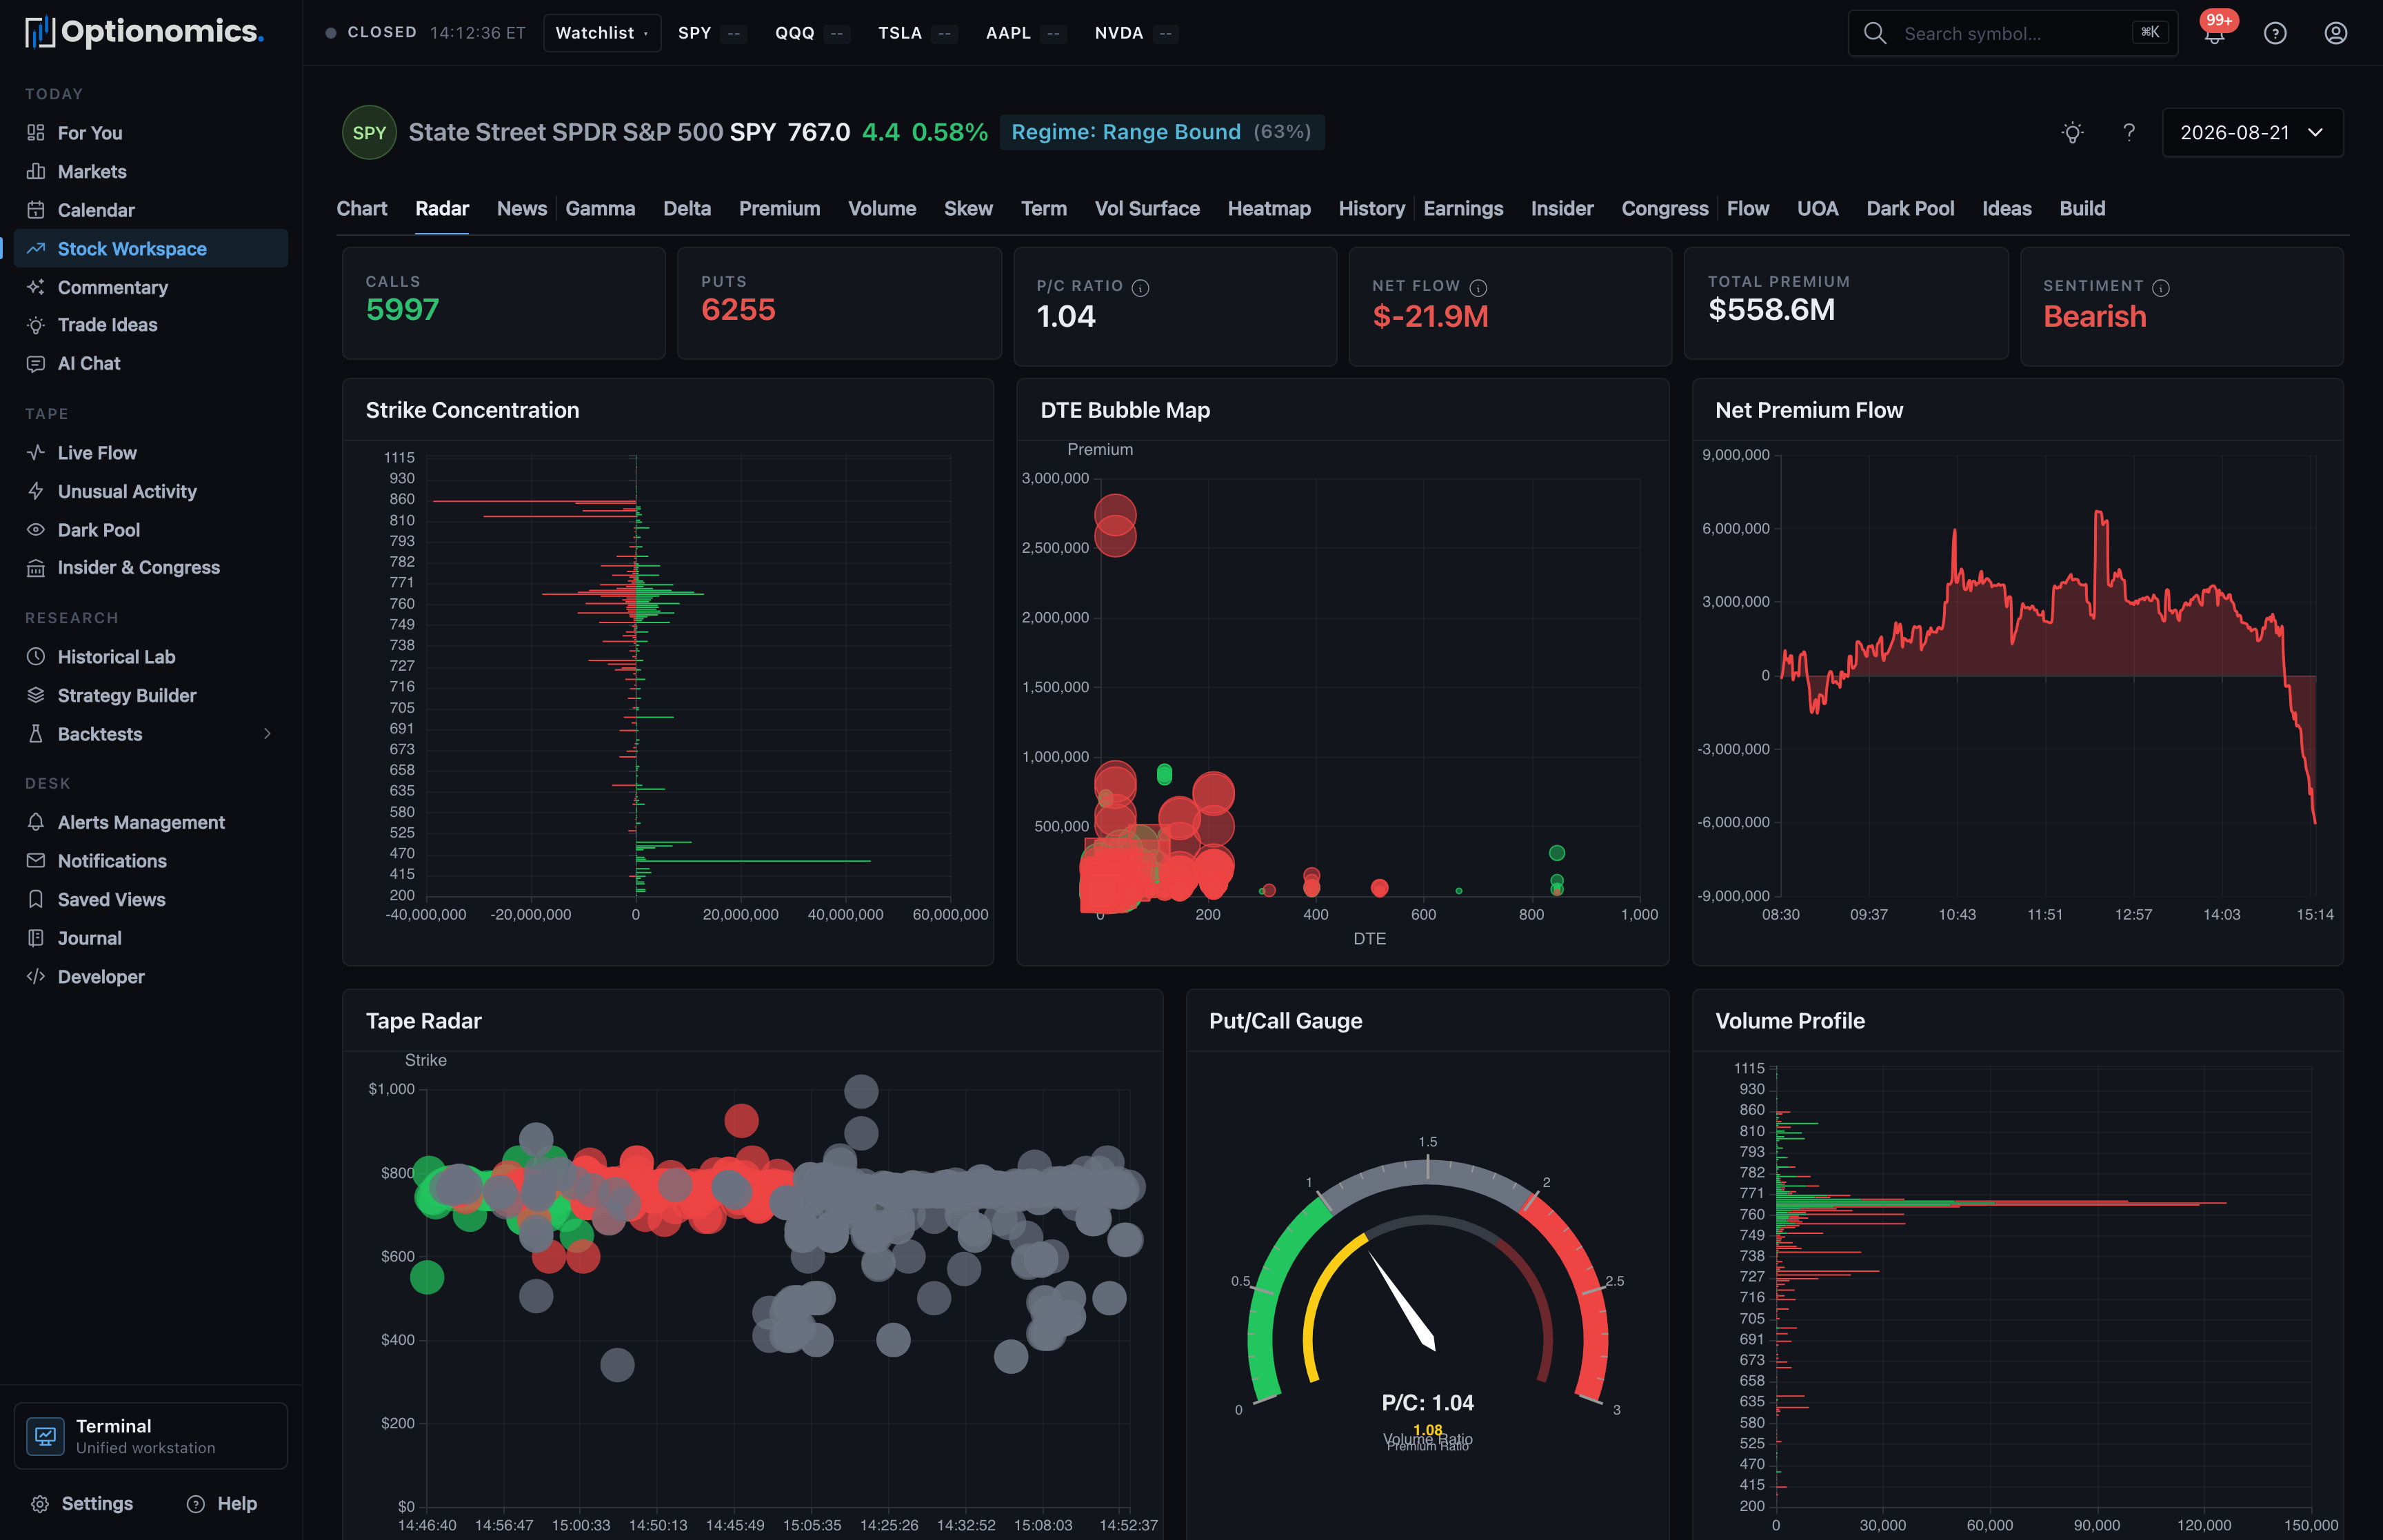
What Radar is
Radar is the fast structural view inside Stock Workspace. It organizes a symbol’s options activity into multiple panels so you can see where contracts, premium, sentiment, volatility, and execution behavior are concentrated without reading every print first.
Availability: Gamma plan and higher.
Open it: Search for a symbol, open the Stock Workspace, and choose Radar. Radar is also available as a center tab in the Terminal and in the iOS Terminal.
Summary row
Six stat tiles provide the selected session’s high-level context:
- Calls and Puts counts
- P/C Ratio
- Net Flow
- Total Premium
- Sentiment (bullish/bearish/neutral, colored by the net-flow sign)
These values summarize the activity included in Radar. A bullish or bearish label describes classified flow; it does not prove that every trade was directional or opening.
Radar panels
| Panel | What to look for |
|---|---|
| Strike Concentration | Strikes where activity is clustered |
| DTE Bubble Map | How activity is distributed across time to expiration |
| Net Premium Flow | The balance and timing of call- and put-side premium |
| Tape Radar | A compact comparison of notable tape characteristics |
| Put/Call Gauge | Relative call and put activity |
| Volume Profile | Where contract volume is concentrated |
| Sentiment Flow | How classified sentiment changes through the session |
| IV Trend | Changes in implied volatility for the selected context |
| Delta Momentum | Changes in aggregate directional exposure measures |
| Smart Flow Tracker | Activity that meets the panel’s visible significance criteria |
| IV Skew | Differences in implied volatility across strikes |
| Aggression | Where trades executed relative to the quoted market |
Radar updates live while the current session is on screen; historical sessions are stable snapshots.
Flow Pattern Match
When today’s flow profile resembles enough prior sessions, a Flow Pattern Match card appears: how many similar historical days were found, their average next-day return, the share that closed positive, and the closest matching dates. It only renders once at least three comparable days exist—no card means today’s profile has too few precedents to summarize.
Treat pattern matches as a research shortcut, not a prediction: similarity is measured on flow characteristics, and a handful of matching days is a small sample.
A practical workflow
- Check the summary row for the broad balance of calls, puts, premium, and sentiment.
- Use Strike Concentration and Volume Profile to find where activity is clustered.
- Use DTE Bubble Map to separate immediate activity from longer-dated positioning.
- Compare Net Premium Flow, Sentiment Flow, and Aggression for consistency.
- Review IV Trend and IV Skew before assuming a directional trade is inexpensive.
- Open Options Flow or Unusual Options Activity for the individual prints behind the story.
Important limitations
- Options activity can represent opening trades, closing trades, spreads, stock hedges, or portfolio hedges.
- Trade-side and sentiment labels are classifications based on observable market data, not confirmed trader intent.
- Large or aggressive activity can still be early, hedged, or wrong.
- A concentration at one strike is context, not guaranteed support, resistance, or a price target.
Use Radar to decide where to investigate next, not as a standalone trading signal.
