Developer Console
Keys, request logs, MCP tools, and webhook deliveries in one portal
What the developer console is
The developer console is one portal for everything programmatic: your API keys, a log of every REST call your integrations made, MCP client setup and its call log, an in-browser tool console, and the delivery log for alert webhooks. On Developer and Developer Pro, open it from the sidebar (Developer, under Desk) or from the account menu (Developer console); it opens on the first page your plan includes.
Availability:
| Page | Who can open it |
|---|---|
| API keys (/developers/keys) | Any signed-in account. Without the Developer plan, a key is a free MCP key that reads the previous session. |
| MCP clients (/developers/clients) | Any signed-in account |
| API requests, MCP console, MCP logs | Developer and Developer Pro |
| Websocket | Developer Pro |
| Webhooks | Any paid plan (it is the delivery log for alerts) |
| API reference | Everyone, no account needed |
A page outside your plan shows a padlock in the console’s tab strip and leads to the plans page. Developer in the sidebar opens the API keys page for every signed-in account, so you can create your free MCP key from there.
The pages
| Page | What it holds |
|---|---|
| API keys | Create and revoke keys, see what they reach on your plan, and copy the REST and MCP addresses they are used with (details) |
| API requests | Every REST call your integrations made—endpoint, result, size, latency—with 24-hour tiles for request count, success rate, failures, and average latency, your request quota for the minute, and a slowest-endpoints strip |
| MCP clients | Point Claude, Cursor, or VS Code at the server, and see which clients have actually called recently |
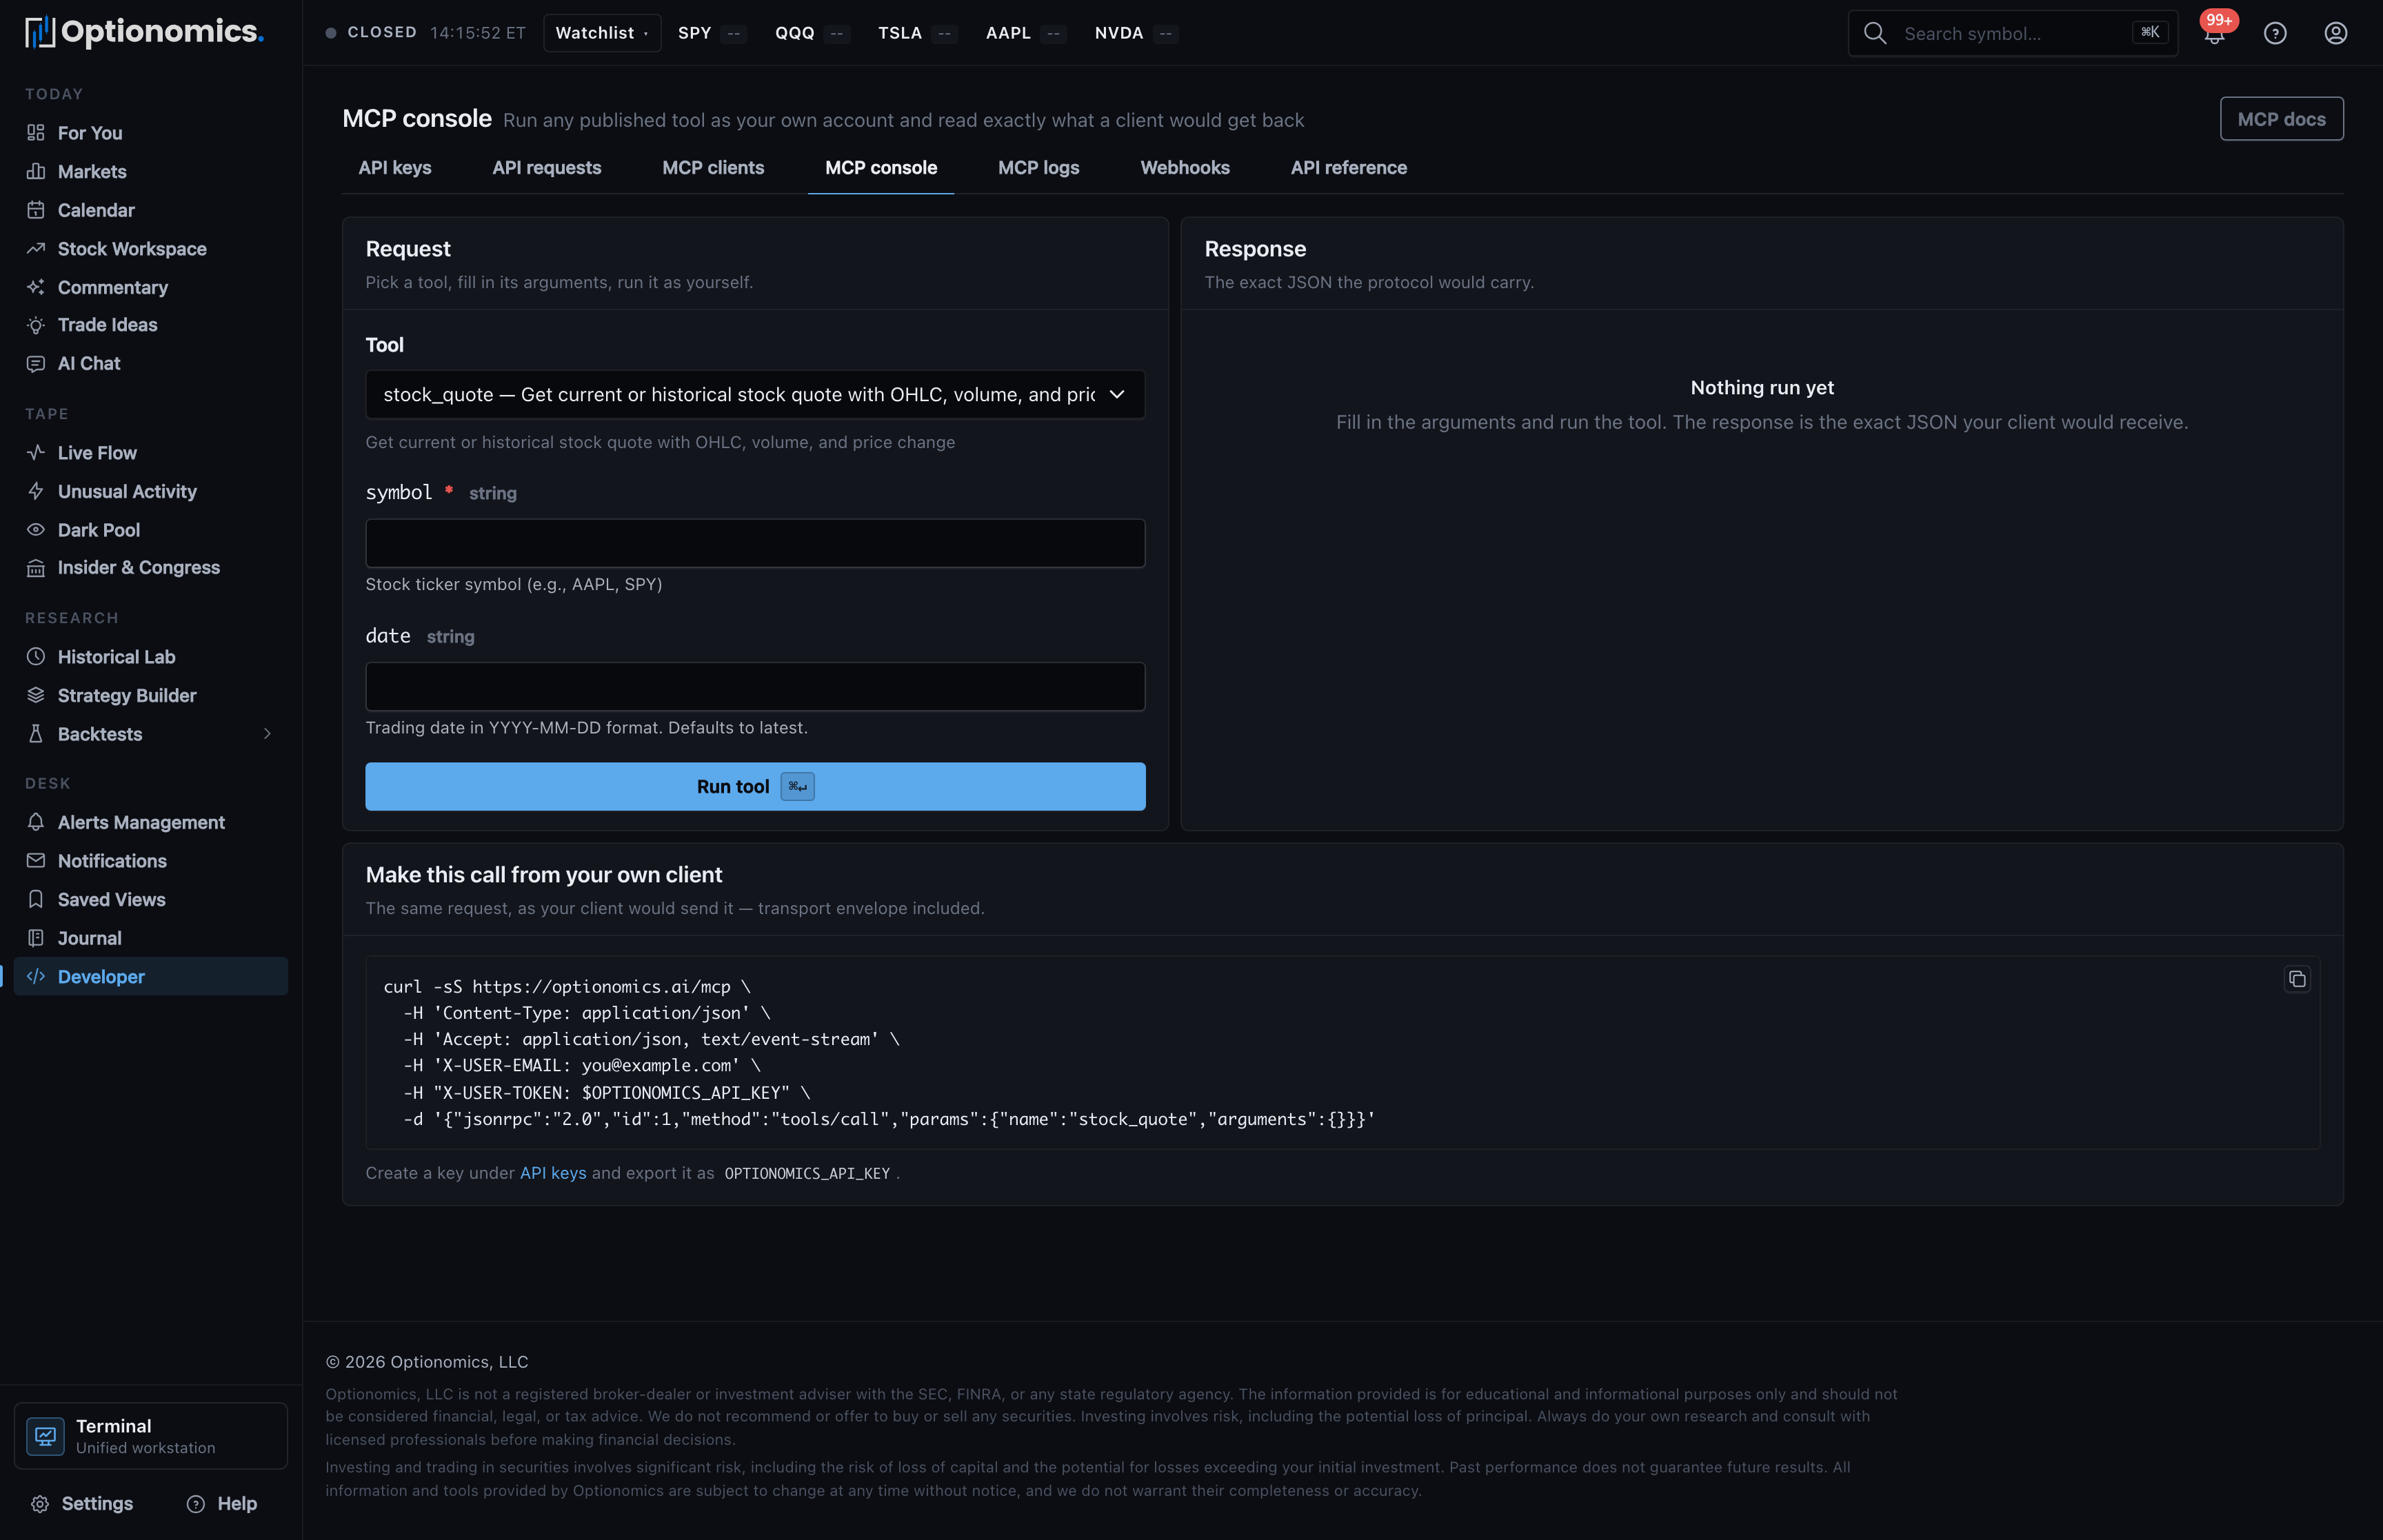
| MCP console | Run any published tool from the browser as your own account |
| MCP logs | Every tool call your clients made—arguments, response, latency |
| Websocket | The websocket’s address, its topics, and a Node.js and a Python client to start from (details) |
| Webhooks | Every Slack, Discord, and custom-URL request Optionomics sent for your alerts |
| API reference | The public reference, which opens outside the app shell |
API keys
The keys page has four parts:
- Keys — your keys, with creation date, expiry, last-used time, and a revoke button per row. Create key at the top right opens the dialog for a new one; the new key is shown once, in a Your new API key panel with a working cURL request beneath it.
- What your keys reach on your plan — one panel with three columns that state, for your own account:
- REST API and MCP — on Developer and Developer Pro, “the live session, every endpoint and every tool”; without Developer, that the key is a free MCP key reading the previous session’s readings, with a link to the Developer plan.
- Websocket — on Developer Pro, what it pushes and a link to the Websocket tab, where its address and topics live; on any other plan, that Developer Pro opens it.
- Requests — your allowance a minute, REST and MCP together: 1,000, or 5,000 on Developer Pro.
- Where the key goes — your account email and the REST base URL (
https://optionomics.ai/api/v1; MCP clients post tohttps://optionomics.ai/mcpinstead). - Your first request — a cURL example that reads your key from an
$OPTIONOMICS_API_KEYshell variable.
Full details are in API Key Management.
Websocket
The Websocket tab (/developers/websocket), on Developer Pro, has three parts:
- Connect — the address
wss://optionomics.ai/socket/websocket, ready to copy. You sign in with an API key sent as thetokenconnect parameter; no client library is needed. A key on any other plan is refused at the connection. - Topics — each topic, the event it sends, and what it pushes:
trade_ideas,market_commentaries, andreadings:signals. - Node.js and Python — a complete client in each language that joins
trade_ideas, so the example you copy works as it is.
The Websocket guide explains the frame format and every payload.
API requests and MCP logs
Both logs work the same way: filter by endpoint or tool and by outcome (answered, refused, failed), open any row for the request’s full context, and read the 24-hour tiles for a health picture. A recording toggle controls whether successful calls are kept—useful while integrating, quieter once you are stable.
Under the tiles, the API requests page shows a line such as “1000 requests a minute per account; this minute: 37”. It is read from the same counter the rate limiter uses, so it is accurate even when recording is switched off, and it counts REST and MCP calls together. When a client starts getting 429 responses, this line tells you whether you are at the ceiling.
Use these logs to answer “my client is getting 429s” or “what did the server actually return?” without adding logging on your side.
MCP clients
The MCP clients page is the fastest way to connect an AI client, and it is open to any signed-in account:
- Connect a client — pick Claude Desktop, Claude Code, Cursor, or VS Code and copy the generated config, with your email already filled in. Cursor and VS Code also get one-click install buttons. The config never contains your key: replace
paste-your-api-keywith it yourself. - Seen recently — the client applications that have actually called the server with your keys, so you can confirm a setup end to end.
- The endpoint — the server address, ready to copy.
The full client-by-client walkthrough, and what a free key can read, is in the MCP Server guide.
MCP console
The MCP console runs any published tool from the browser, as your own account:
- Pick a Tool from the list—the form for its arguments is generated from the tool’s own schema.
- Choose Run tool (or ⌘↵).
- Read the exact JSON a connected client would receive, with the byte size and duration.
The console also prints the equivalent raw request so you can reproduce the call from your own client, and each run lands in the MCP log like any other call. Console runs count against the same per-minute allowance as real API and MCP traffic.
Webhooks
The Webhooks page is the delivery log for alert notifications sent to Slack, Discord, and custom HTTPS endpoints: per-attempt status, latency, and response details, with 24-hour tiles for attempts, success rate, failures, and latency. Failed deliveries are always recorded; a Failures only switch controls whether successes are kept too.
When a Slack message stops arriving, this page answers whether Optionomics sent it and what the receiving end said.
