For You Dashboard
Your configurable market home base
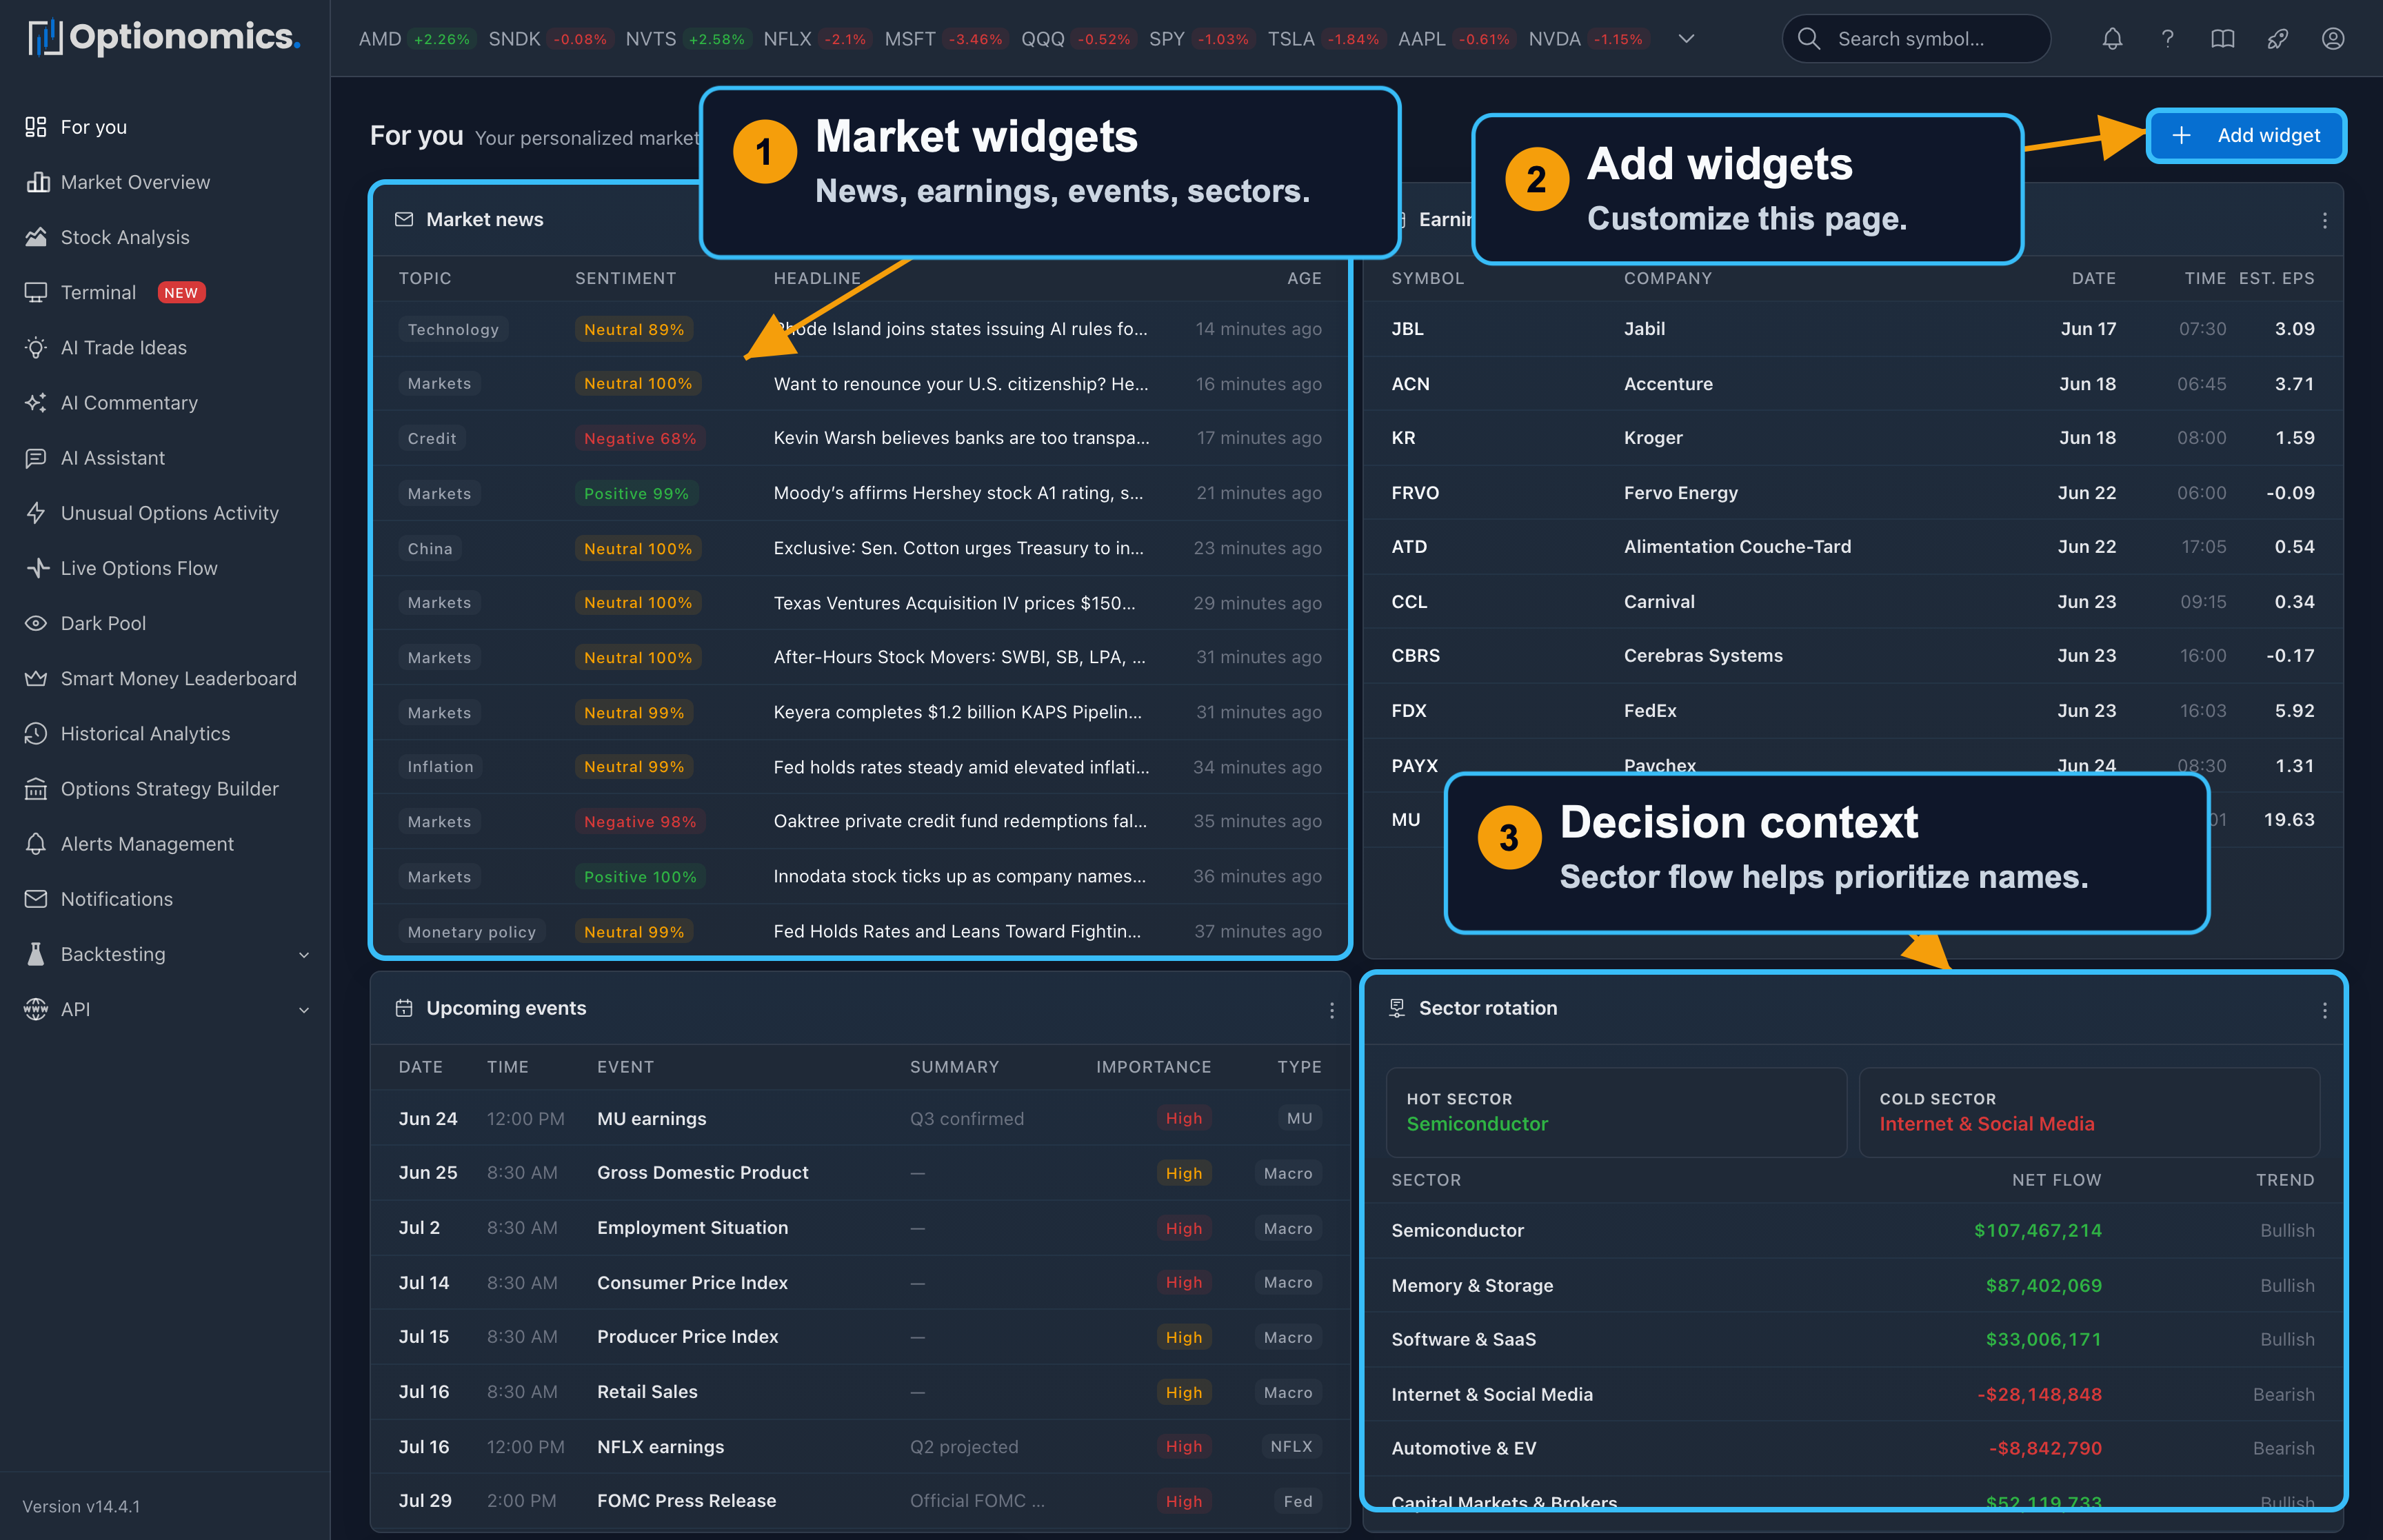
What For You is
For You is your personalized landing page. Instead of opening five screens every morning, you can build one dashboard with the widgets that match your routine: market news, earnings, upcoming macro events, sector rotation, watchlist movers, unusual activity, option flow, trade ideas, open trades, journal stats, saved views, notes, and more.
Use it as a command center: start broad, spot what changed, then click through to the deeper feature page when something deserves attention.
Availability: Any active subscription. The widget catalog only shows widgets available to your plan.
Widget catalog
The picker groups the catalog into five categories:
- Market: Watchlist movers, Top movers, Market Pulse, Market sentiment, Market context, Symbol price chart, Watchlist sparklines, Sector rotation, Volume leaders, Market news, Top premium symbols, Earnings calendar, and Upcoming events
- Flow: Option flow, Unusual activity, and Dark-pool levels
- Research: Watchlist news, Market commentary, AI trade ideas, Symbol research, and Saved views
- Workflow: Triggered alerts, Open trades, Alert performance, and Journal stats
- Personal: Note — a free-form note for checklists and watch ideas
Widgets tied to Flow or AI features appear only when your plan includes that feature—flow-driven widgets from Gamma, commentary and trade ideas from Theta.
How to use it
- Open For You from the sidebar.
- Click Add widget and pick a widget from the category groups.
- Choose its settings—most widgets offer symbols (blank usually means your watchlist or the whole market), a lookback or window, a row limit, an optional title, and a width (one third, half row, two thirds, or full row).
- Arrange the dashboard: drag a tile by its header, or use Move up / Move down in its menu.
- Customize or Remove widgets from each tile’s menu as your workflow changes.
The dashboard refreshes itself on a shared timer, and flow-driven tiles also update live off the options tape.
Useful starter layouts
| If you are… | Start with these widgets |
|---|---|
| New to the platform | Market news, Earnings calendar, Upcoming events, Sector rotation |
| Flow-focused | Option Flow, Unusual Activity, Dark-Pool Levels, Top Premium Symbols |
| Watchlist-focused | Watchlist movers, Watchlist news, Watchlist sparklines, Symbol research |
| Alert-driven | Triggered alerts, Alert performance, Saved views |
| Journaling trades | Open trades, Journal stats, Notes |
Beginner workflow
Start with Market news and Earnings calendar so you know what may move the tape. Add Sector rotation to see which groups are attracting or losing flow. Then add one or two watchlist or flow widgets for the names you actually trade.
If a widget shows something interesting, click the symbol or related link and continue in the full feature page: Stock Workspace, Live Options Flow, Unusual Options Activity, Trade Ideas, or Trade Journal.
Best practices
- Keep the first screen focused. Too many widgets can turn a dashboard back into noise.
- Use wide widgets for charts and dense tables, and narrower widgets for summaries.
- Put the highest-priority widgets at the top so they are visible without scrolling.
- Review your layout after a week and remove anything you did not actually use.
Remember: For You helps you organize your process. It does not decide what to trade.
